MapsGL - Data-Driven Styling
Many paint properties support data-based styling, which allows you to return different styling configurations based on the modal data for each instance or the map’s current state, such as zoom level. To use data-driven styling, you’ll need to provide a function instead of a value for any paint style property and return the appropriate value for that property from the function.
Using Property Values
Sometimes your data source may provide the style information necessary for your layer and renderer type. This can often be the case when using vector or GeoJSON data sources where additional model data and properties are provided for each geospatial feature.
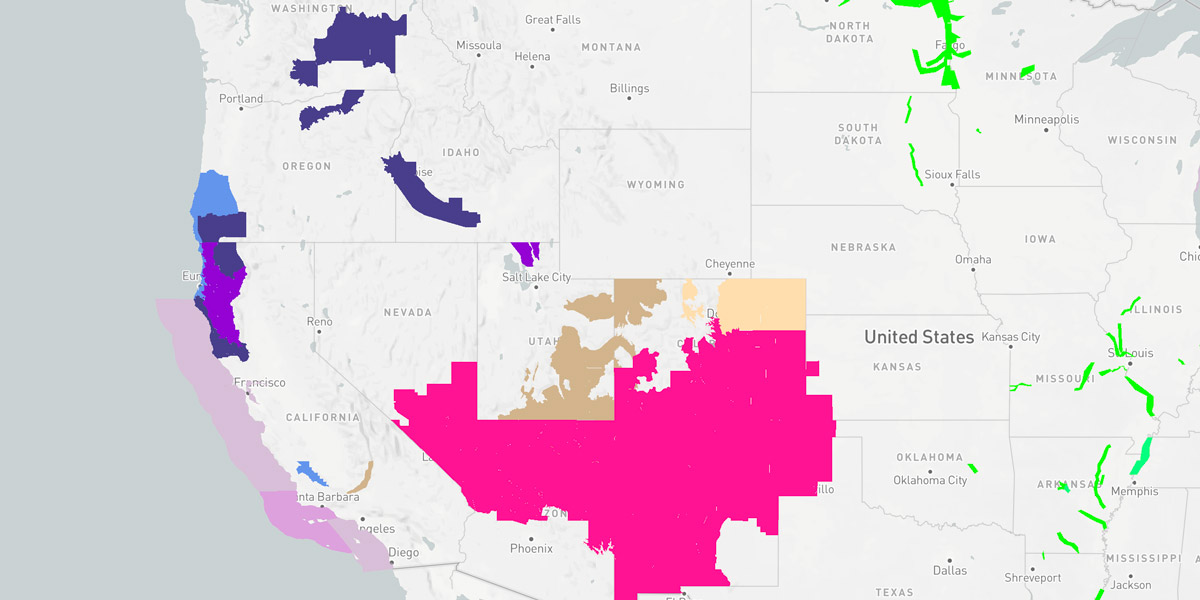
For example, our vector alerts tile set also includes information about each alert alongside its geometry data, such as the name of the alert, valid and expires times and the standard color used. If you wanted to render alerts and created your own vector tile data source, you can configure your fill.color paint property to reference the key path that corresponds to the property containing the color value to use.
To reference a feature’s property value, just set your paint property using the following property format:
{
    property: '[PROPERTY_KEY_PATH]'
}
For alerts vector tiles, each feature’s alert-related properties are given to us in the following structure:
{
    ADVISORY: "FLOOD WARNING"
    CAT: "flood"
    COLOR: "00FF00"
    EXPIREDATE: 1652270400
    LOCATION: "madison"
    STARTDATE: 1652112060
    VTEC: "FL.W"
    ZONE: "ILC119"
}
For rendering our data, we want to use the value from the COLOR property for each feature’s fill color:
controller.addLayer('alerts', {
    type: 'fill',
    source: 'alerts',
    paint: {
        fill: {
            color: {
                property: 'COLOR'
            }
        }
    }
});
Oftentimes the property you need is within a nested object in the feature’s object structure, in which case you can also provide the property’s key path using dot-notation. If the alert feature’s data was instead provided in a structure similar to:
{
    alert: {
        name: "FLOOD WARNING",
        info: {
            category: "flood",
            color: "00FF00"
        }
    }
}
We could then use alert.info.color to reference that nested property:
controller.addLayer('alerts', {
    type: 'fill',
    source: 'alerts',
    paint: {
        fill: {
            color: {
                property: 'alert.info.color'
            }
        }
    }
});
You can use the same approach for essentially any paint property when rendering vector datasets.
Using Data Evaluators
When you need greater control over data-driven styles or your datasets do not contain the necessary style information, you can instead provide a data evaluator function to return the style information for an individual paint property or your entire paint configuration. These functions will receive the data and properties for each geospatial feature returned by the data source. The function should then evaluate the data and return the appropriate value or paint configuration based on that feature’s data.
A data evaluator function has the following structure:
const evaluator = (data) => {
    // derive and return style infomration from the `data` object...
};
For example, you start with a basic circle style layer to render current earthquake data from our Weather API. You could configure the layer and its styling as follows:
controller.addLayer('earthquakes', {
    type: 'circle',
    source: 'earthquakes',
    paint: {
        fill: {
            color: '#ff0000'
        },
        stroke: {
            color: '#ffffff',
            thickness: 3
        },
        circle: {
            radius: 10
        }
    }
});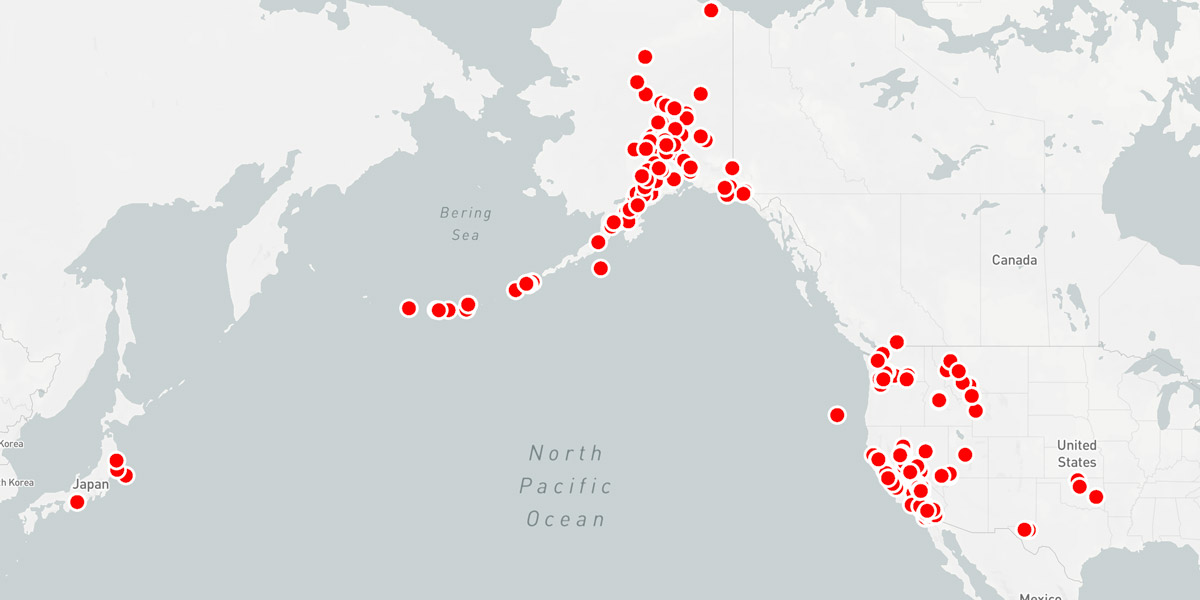
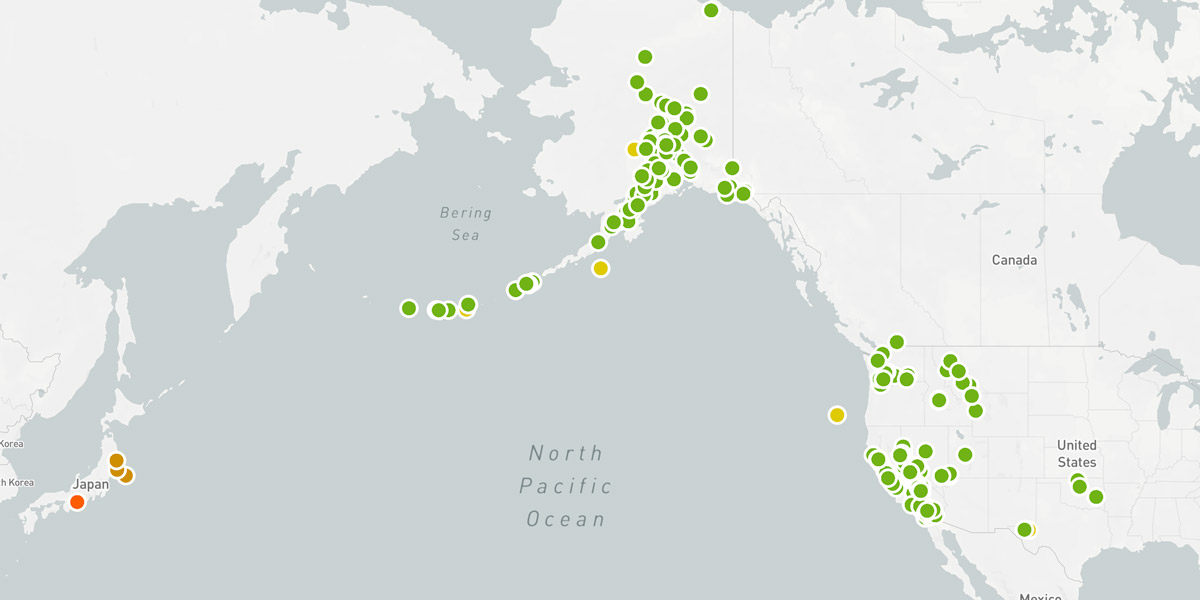
But coloring each earthquake report the same color isn’t a very useful data visualization since it tells the user nothing about the actual data, such as quake magnitude. A better approach would be to configure our fill style to derive a fill color based on the magnitude of each earthquake report as provided by our weather API’s earthquake endpoint:
controller.addLayer('earthquakes', {
    type: 'circle',
    source: 'earthquakes',
    paint: {
        fill: {
            color: (data) => {
                // `data` is the raw data from the vector feature
                const report = data ? data.report : null;

                // exit if there's no report data
                if (!report) return;

                // map earthquake types to a fill color
                const colors = {
                    mini: '#6fb314',
                    minor: '#dfcb01',
                    light: '#ce8f00',
                    moderate: '#ff5d01',
                    strong: '#e90004',
                    major: '#ce0052',
                    great: '#b90285',
                    catastrophic: '#f500ff'
                };

                const magnitude = report.mag;
                let type = report.type ? report.type.toLowerCase() : 'mini';

                // our maximum color type is `catastrophic`, so clamp higher magnitude values
                if (magnitude >= 9) type = 'catastrophic';

                return colors[type];
            }
        },
        stroke: {
            color: '#ffffff',
            thickness: 3
        },
        circle: {
            radius: 10
        }
    }
});
The above paint style configuration will result in the following output:
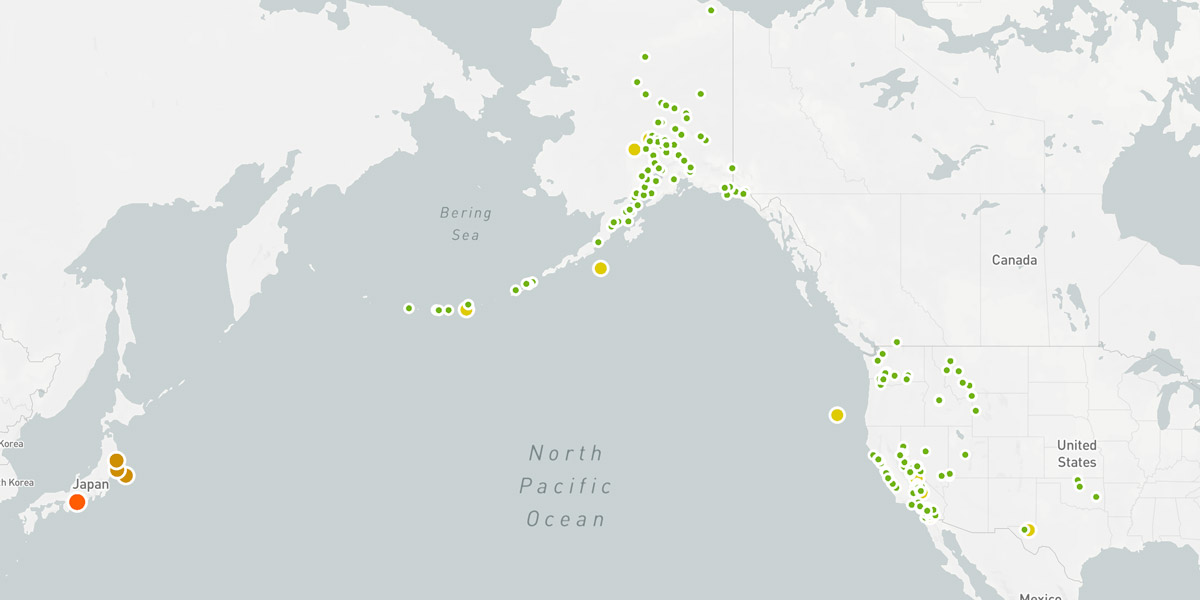
Additionally, if you have multiple paint properties that are data-driven, you can instead use a single function for your layer’s paint value and return the style information in a single object from this function. So we can take the above example even further and update it to also control circle radius values based on the same magnitude data so that larger earthquakes have a greater visual impact:
controller.addLayer('earthquakes', {
    type: 'circle',
    source: 'earthquakes',
    paint: (data) => {
        // `data` is the raw data from the vector feature
        const report = data ? data.report : null;

        // exit if there's no report data
        if (!report) return;

        // map earthquake types to a fill color
        const colors = {
            mini: '#6fb314',
            minor: '#dfcb01',
            light: '#ce8f00',
            moderate: '#ff5d01',
            strong: '#e90004',
            major: '#ce0052',
            great: '#b90285',
            catastrophic: '#f500ff'
        };

        // map earthquake types to a size (radius * 2)
        const sizes = {
            mini: 12,
            minor: 18,
            light: 20,
            moderate: 22,
            strong: 26,
            major: 30,
            great: 36,
            catastrophic: 42
        };

        const magnitude = report.mag;
        let type = report.type ? report.type.toLowerCase() : 'mini';

        // our maximum color type is `catastrophic`, so clamp higher magnitude values
        if (magnitude >= 9) type = 'catastrophic';

        // return all style options in a single object
        return {
            fill: {
                color: colors[type]
            },
            stroke: {
                color: '#ffffff',
                thickness: 3
            },
            circle: {
                radius: sizes[type] / 2
            }
        };
    }
});
Controlling both the color and size based on feature data will result in the following output:
You can use a custom style evaluator function for individual style properties, such as color or size, or as a single paint value only and not for style property groups such as fill or circle. Refer to the list of supported style properties and their expected return types for each render style listed above when using data-driven styling.
Note, however, that some paint properties are evaluated before data is rendered, meaning they cannot be updated once the initial styles have been calculated and data buffers created.
Styling Weather Data
Since the above example is using data provided by one of our built-in weather layers, it could have also been added to the map using addWeatherLayer without a data source reference while still providing the same custom style overrides provided in the above examples:
controller.addWeatherLayer('earthquakes', {
    paint: {
        // custom style configuration...
    }
});
Refer to our supported weather layers and weather layer styling documentation for more details and examples when working with weather layers within the MapsGL SDK.