MapsGL - Data Inspector Control
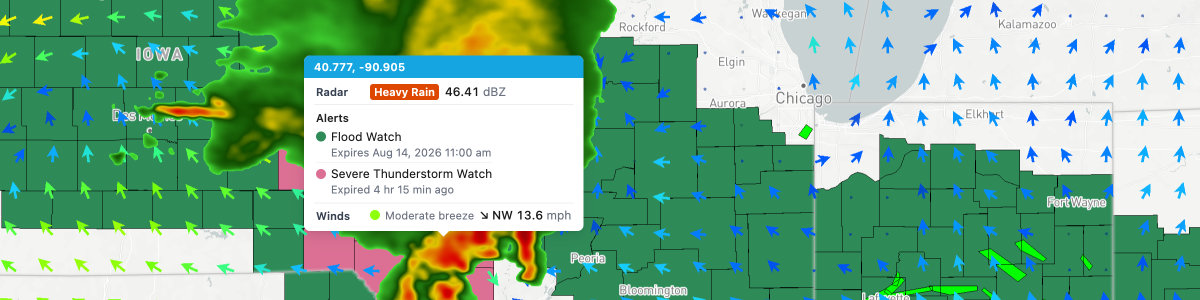
A data inspector control shows the underlying data for each visible map layer that supports feature queries. It can appear only when the map is clicked, or stream values as the pointer moves.
Starting with MapsGL 1.10.0, built-in weather evaluators format values in the map’s preferred units, and many layers render richer rows — category badges, colorscale swatches, alert timing, tropical stats, and similar — instead of a plain number string.
// Adds a data inspector control to the map, returning the control instance
const control = controller.addDataInspectorControl(options);

// Removes the data inspector control
controller.removeDataInspectorControl();
Configuration
The following configuration options are supported when instantiating DataInspectorControl instances:
| Option | Description | Default |
|---|---|---|
event | Type: click or move (optional)The event mode for the control:- click: Control will only appear and query data when the map is clicked/tapped. - move: Control will remain visible and continuously query map features and data as the mouse is moved over the map. | |
stream | Type: boolean (optional)Whether feature queries should happen continuously while map data is animating. If true, then the control will continuously update its values even during animation playback. | |
showCoordinates | Type: boolean (optional)Whether to show the queried latitude/longitude above the layer rows. Set to false to show only feature values. | |
layout | Type: auto or stacked (optional)How each layer row is arranged. See row layout. | |
controller.addDataInspectorControl({
    event: 'move',
    showCoordinates: false,
    layout: 'auto'
});
Row layout
Each contributing layer becomes one row with a title and a value cell.
layout | Behavior |
|---|---|
auto (default) | Compact one-liners (scalars, badge-only, badge + inline value such as radar) stay title | value side-by-side. Multi-line content (alerts, stats strips, tropical stacks, progress bars) stacks title above value. |
stacked | Title above value for every row. |
Use stacked when you want a consistent hierarchy, especially if many compact rows feel cramped side-by-side.
Units
Built-in evaluators convert and format values using the map controller’s current unit preferences — a single unit per measurement, not a hardcoded dual string such as kph, mph. Changing units with setUnits or setUnitsForSystem refreshes an open inspector in place.
If you override an evaluator, use the units argument passed to fn instead of always printing both metric and imperial. See data evaluators.
Built-in weather content
You do not need a custom evaluator for standard weather layers. The SDK already attaches formatters that can include:
- A colorscale swatch next to scalar samples (temperatures, radar, and similar)
- Category badges for alerts, AQI, tropical storm class, radar precip type, and outlook categories
- Distinct AQI titles such as
AQI (China),AQI (India),AQI (European), andAQHI - Alert start / expire timing
- Dew point and cloud cover
- Wildfire containment as a progress bar
- Tropical cyclone stats (wind, pressure, motion)
When observation and forecast model layers of the same variable are both visible, matching scalar rows are merged into one stats strip (for example Temperature with Xweather, GFS, and NBM values). A lone model layer keeps a qualified title such as Temperature (GFS).
Query behavior
- Clicks or pointer moves that are not on the map surface (pitched sky, globe limb, or beyond mercator limits) hide the tooltip instead of reporting a clamped coordinate.
- Nodata and masked-out locations do not produce a row for that layer.
- Overlapping vector features return the top-most drawn feature first, matching what you see on the map.
Methods
The following methods are available on DataInspectorControl instances:
addTo(target: HTMLElement | string)show(point: Point, coord?: Coordinate)hide()enable()disable()update()setEvaluator(layerId: string, evaluator: DataEvaluator)remove()Data Evaluators
Data evaluators format queried values for a layer row. You can also supply a custom title instead of the default, which is derived from the layer identifier.
The MapsGL SDK already includes built-in evaluators for the available weather layers. Override them only when you need different text or additional content. Set a custom evaluator either when adding a weather layer or later with setEvaluator on the control.
An evaluator fn receives:
data— the query result for that layer (a number-like sample usesdata.value; winds also includespeed/angle)units— the map’s currentMapUnitscontext(optional) —{ layerId, paint }for the live layer. Usepaintto color a swatch or badge from the layer’s current style, including any paint overrides. See using paint context.
Return a string. Plain text is shown as the value cell. HTML is allowed for structured content; escape any feature or user strings you interpolate.
Customizing via Weather Layer Overrides
When you add a weather layer, you can override its evaluator. Format with the map’s preferred unit instead of hardcoding both systems:
const unitsLib = aerisweather.mapsgl.units;

controller.addWeatherLayer('temperatures', {
    data: {
        evaluator: {
            title: 'Temperature',
            fn: (data, mapUnits) => {
                const celsius = data.value;
                if (mapUnits.temperature === 'F') {
                    return `${unitsLib.CtoF(celsius).toFixed(1)}°F`;
                }
                return `${Number(celsius).toFixed(1)}°C`;
            }
        }
    }
});
Wind and other vector samples pass speed and angle on the result object:
const unitsLib = aerisweather.mapsgl.units;

controller.addWeatherLayer('wind-speeds', {
    data: {
        evaluator: {
            title: 'Winds',
            fn: (data, mapUnits) => {
                const speed = data.speed ?? data.value;
                const angle = data.angle - 180;
                const dir = unitsLib.degToDir(angle);
                if (mapUnits.speed === 'mph') {
                    return `${dir} ${unitsLib.msToMph(speed).toFixed(1)} mph`;
                }
                if (mapUnits.speed === 'km/h' || mapUnits.speed === 'kph') {
                    return `${dir} ${unitsLib.msToKph(speed).toFixed(1)} km/h`;
                }
                return `${dir} ${Number(speed).toFixed(1)} m/s`;
            }
        }
    }
});
Using paint context for swatches and badges
The third context argument is { layerId, paint }. paint is the layer’s live paint style, so badge and swatch colors stay in sync when you override fill.color or sample.colorscale.
Scalar sample rows that return plain text already get a colorscale swatch prepended by the control. Returning HTML skips that automatic swatch — evaluate context.paint yourself when you want a colored badge or chip.
Escape any feature strings you put into HTML. A small helper:
const escapeHtml = (value) => String(value ?? '')
.replaceAll('&', '&')
.replaceAll('<', '<')
.replaceAll('>', '>')
.replaceAll('"', '"');Fill color badge
For fill, circle, and other vector layers, evaluate paint.fillColor against the hit feature. That runs the same data-driven color expression the map uses (for example alert COLOR or tropical details.stormCat):
controller.addWeatherLayer('alerts', {
    data: {
        evaluator: {
            title: 'Alert',
            fn: (data, _units, context) => {
                const feature = data.features?.[0];
                if (!feature) {
                    return '';
                }

                const name = escapeHtml(
                    feature.details?.name || feature.advisory || 'Alert'
                );

                let hex;
                try {
                    const color = context?.paint?.fillColor(feature);
                    if (color && color.a !== 0 && typeof color.toHex === 'function') {
                        hex = color.toHex();
                    }
                } catch (error) {
                    hex = undefined;
                }

                if (!hex) {
                    return name;
                }

                return (
                    `<span style="display:inline-flex;align-items:center;gap:6px;">` +
                    `<span style="display:inline-block;width:8px;height:8px;border-radius:50%;background:${escapeHtml(hex)};"></span>` +
                    `<span>${name}</span>` +
                    `</span>`
                );
            }
        }
    }
});
Sample colorscale swatch
For encoded sample layers, read the live colorscale with paint.sampleColorScale() and pick a stop for data.value. This respects custom sample.colorscale overrides the same way the built-in swatch does:
const colorFromStops = (stops, value) => {
    if (!Array.isArray(stops) || stops.length < 2 || !Number.isFinite(value)) {
        return undefined;
    }

    let hex = stops[1];
    let best = Infinity;
    for (let i = 0; i < stops.length - 1; i += 2) {
        const distance = Math.abs(Number(stops[i]) - value);
        if (distance < best) {
            best = distance;
            hex = stops[i + 1];
        }
    }
    return typeof hex === 'string' ? hex : undefined;
};

controller.addWeatherLayer('temperatures', {
    data: {
        evaluator: {
            title: 'Temperature',
            fn: (data, mapUnits, context) => {
                const celsius = data.value;
                const unitsLib = aerisweather.mapsgl.units;
                const label = mapUnits.temperature === 'F'
                    ? `${unitsLib.CtoF(celsius).toFixed(1)}°F`
                    : `${Number(celsius).toFixed(1)}°C`;

                let hex;
                try {
                    const colorscale = context?.paint?.sampleColorScale();
                    hex = colorFromStops(colorscale?.stops, celsius);
                } catch (error) {
                    hex = undefined;
                }

                if (!hex) {
                    return label;
                }

                return (
                    `<span style="display:inline-flex;align-items:center;gap:6px;">` +
                    `<span style="display:inline-block;width:8px;height:8px;border-radius:50%;background:${escapeHtml(hex)};"></span>` +
                    `<span>${escapeHtml(label)}</span>` +
                    `</span>`
                );
            }
        }
    }
});
strokeColor works the same way as fillColor when the layer is styled with a stroke instead of a fill.
Customizing via the Data Inspector Control
You can also change a layer’s evaluator after it has been added by calling setEvaluator on the control. Use the MapsGL layer id (from addWeatherLayer / getWeatherLayer), not only the weather code if those differ:
const control = controller.controls.dataInspector;
const unitsLib = aerisweather.mapsgl.units;
const temps = controller.getWeatherLayer('temperatures');
const tempsId = Array.isArray(temps) ? temps[0].id : temps.id;

control.setEvaluator(tempsId, {
    title: 'Temperature',
    fn: (data, mapUnits) => {
        const celsius = data.value;
        if (mapUnits.temperature === 'F') {
            return `${unitsLib.CtoF(celsius).toFixed(1)}°F`;
        }
        return `${Number(celsius).toFixed(1)}°C`;
    }
});