MapsGL - Layer Styles
MapsGL layer styles are fully customizable and support a variety of options depending on the type of data being rendered.
Most paint properties can be configured with static values, but many also support data-driven styling using expressions. This allows you to style your data based on the properties of the data itself, which can be useful for visualizing patterns and trends in your data.
Supported Styles
The following layer render styles are supported:
- raster: Renders basic raster imagery
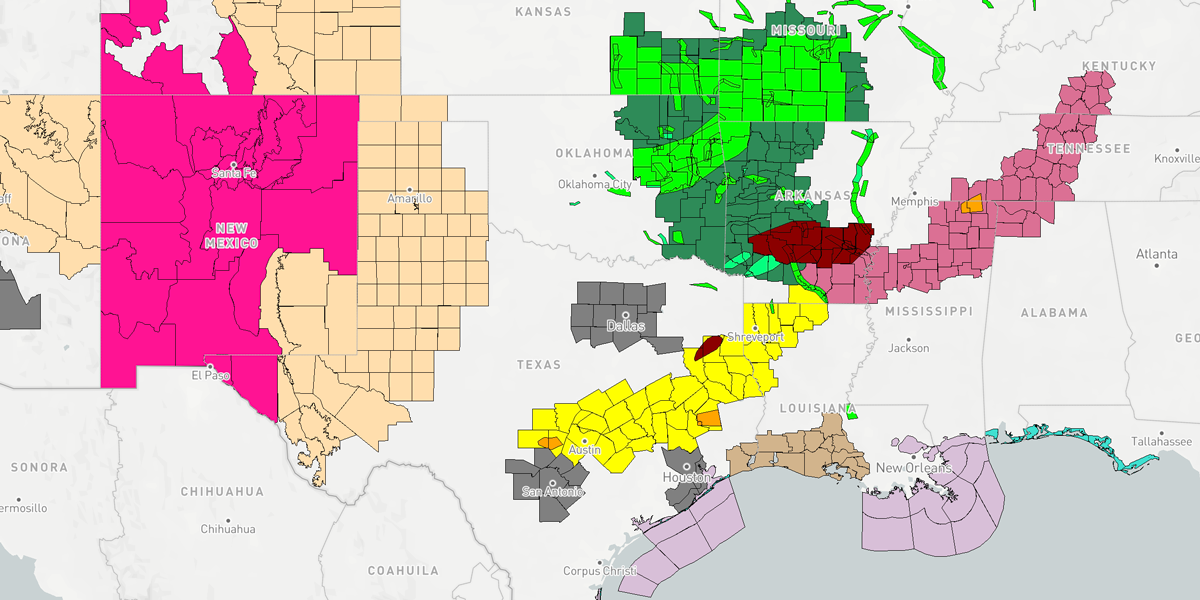
- fill: Renders vector polygon geometry as filled shapes
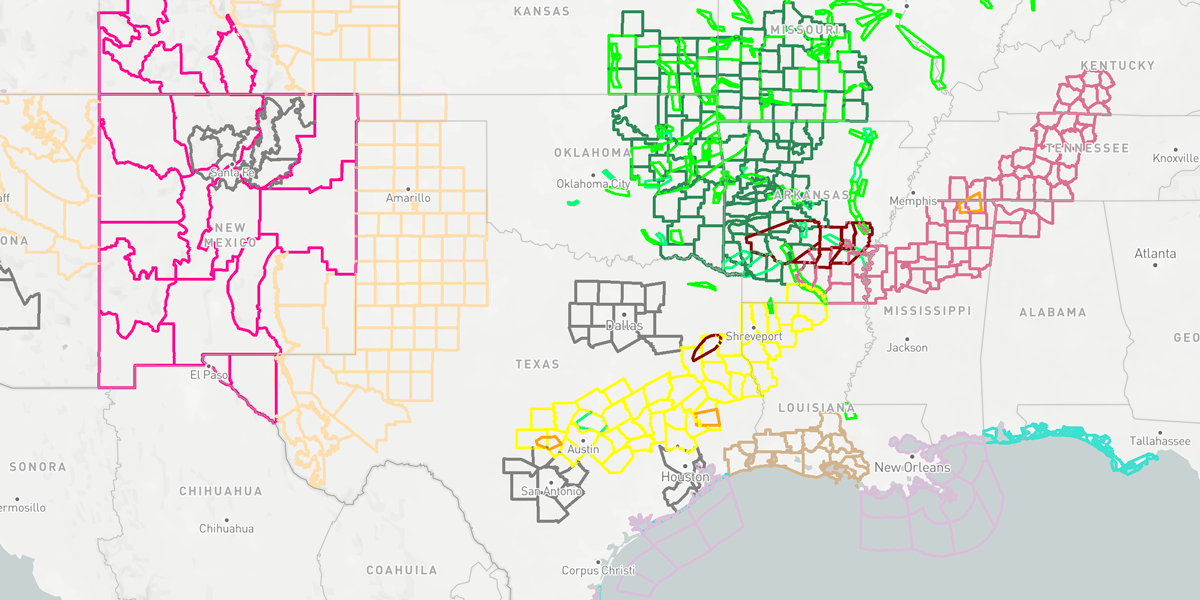
- stroke: Renders vector polygon and polyline geometry as lines
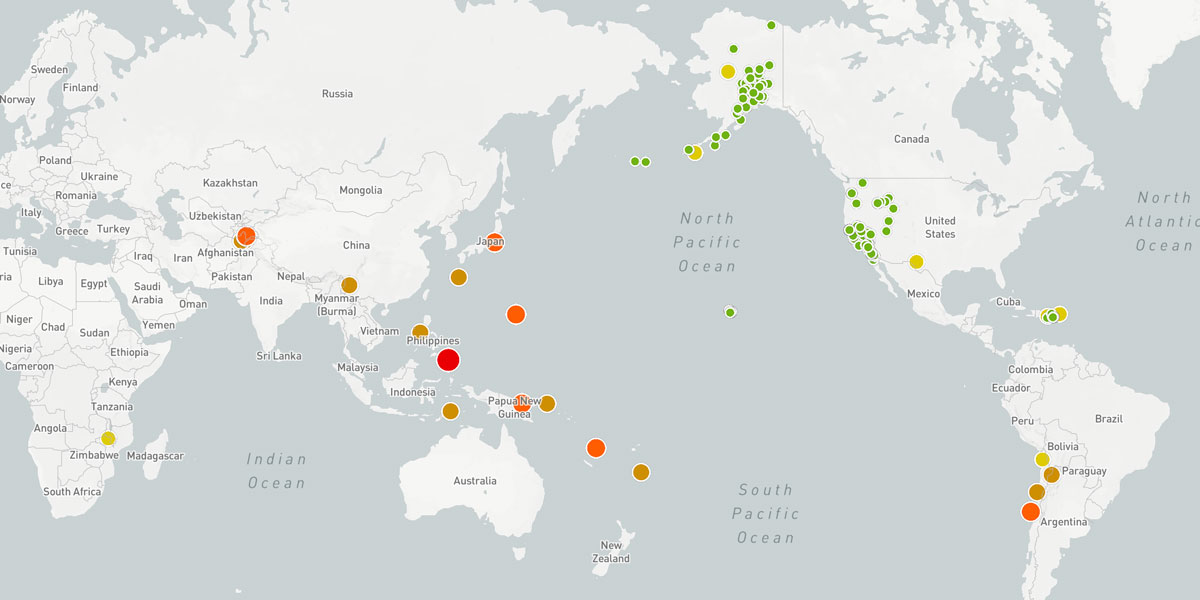
- circle: Renders vector points as circles
- sample: Renders encoded raster data by sampling values and colorizing them based on a color scale
- grid: Renders a grid of points as symbols by sampling encoded raster data at those grid points
- contour: Renders isolines by sampling encoded raster data
- particle: Renders vector data from encoded rasters, such as wind speed or ocean currents, as particle flow fields
- heatmap: Renders the density of vector point data
- icon: Renders vector point features as images custom GLSL shaders
- text: Renders text labels from vector point features
- symbol: Controls how icons and text elements are placed on the map
Layer paint styles are defined using the paint property when configuring your layer. Each style type listed above should be provided as its own property in your paint object:
paint: {
	opacity: number;

	// Specific render style options
    raster: Partial<RasterStyleSpec>;
    fill: Partial<FillStyleSpec>;
    stroke: Partial<StrokeStyleSpec>;
    circle: Partial<CircleStyleSpec>;
    sample: Partial<SampleStyleSpec>;
    grid: Partial<GridStyleSpec>;
    contour: Partial<ContourStyleSpec>;
    particle: Partial<ParticleStyleSpec>;
    heatmap: Partial<HeatmapStyleSpec>;
	icon: Partial<IconStyleSpec>;
	text: Partial<TextStyleSpec> | Array<Partial<TextStyleSpec>>;
	symbol: Partial<SymbolStyleSpec>;
}| Option | Description | Default |
|---|---|---|
opacity | Type: number ()Opacity the entire layer will be drawn. | |
animated | Type: boolean ()Whether the layer is animated. If true, then the layer will be continuously re-rendered to allow for animated shader effects that depend on the overall elapsed time. | |
See each supported style type below for the available customization options and their defaults.
Raster
Raster style properties control how raster tiles get rendered on a map, such as static image tiles like PNG or JPG.
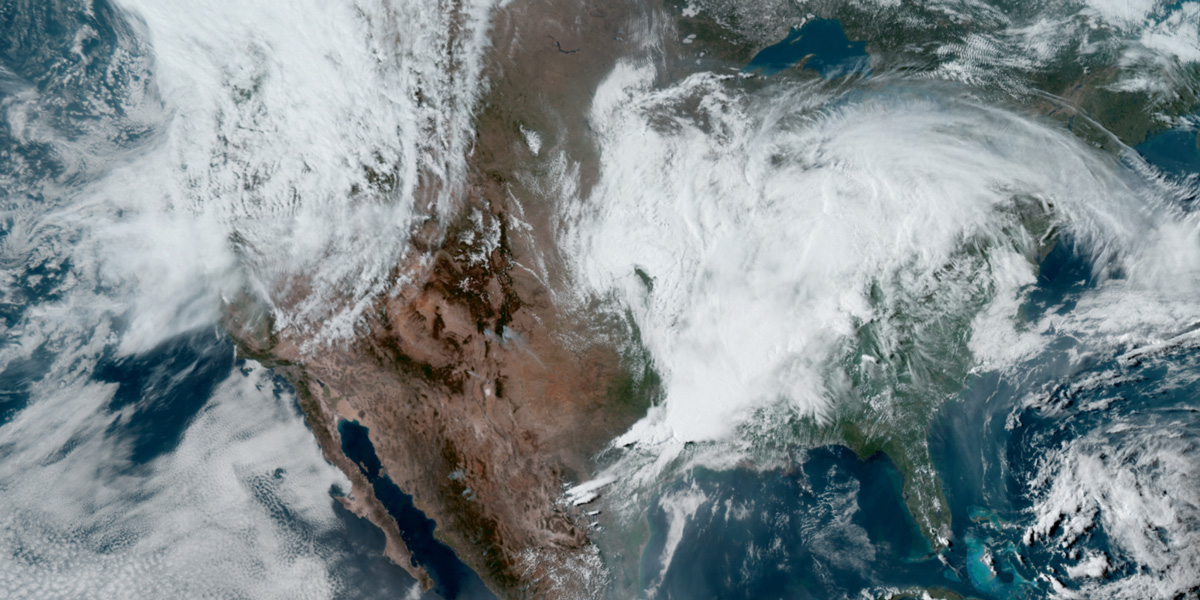
raster: {}Fill
Fill style properties control how one or more polygons (and associated outlines) get rendered on a map. These properties also control the fill for circles and other vector shapes.
fill: {
	color: string | Color;
	pattern: string | { id: string; url: string; };
	opacity: number;
}| Option | Description | Default |
|---|---|---|
color | Type: string or Color ()Color of the fill. Value can be a hex color code or in the form of rgba() to adjust the opacity of the fill without affecting the stroke opacity. | |
pattern | Type: string or { id: string; url: string; } ()Image identifier of the image from the style manager to use for the fill pattern, or an object containing an id and url for remote images. For remote images, id is the identifier to cache the image as and url is the full URL to the remote image. | |
opacity | Type: number ()Opacity of the fill layer, including any stroke associated with the geometry. | |
Stroke
Stroke style properties control how one or more polylines get rendered on a map. These properties also control strokes around circles and other vector shapes.
stroke: {
	color: string | Color;
	thickness: number;
	opacity: number;
	lineJoin: 'bevel' | 'round' | 'miter';
	lineCap: 'butt' | 'round' | 'square';
}| Option | Description | Default |
|---|---|---|
color | Type: string or Color ()Color of the stroke. Value can be a hex color code or in the form of rgba() to adjust the opacity of the stroke without affecting the opacity of other lines in the same layer. | |
thickness | Type: number ()Line thickness in points. | |
opacity | Type: number ()Opacity of the stroke layer. | |
lineJoin | Type: bevel, round or miter ()Controls the method of how lines are joined:- bevel: Squares off the edges of a segment by extending the line a distance of one-half the line’s width beyond the segment endpoint. - round: Rounds off the corners of a segment by filling half a circle centered at the common endpoint of connected segments. The radius for these rounded corners is equal to one-half the line width. - miter: Connected segments are joined by extending their outside edges to connect at a single point, with the effect of filling an additional lozenge-shaped area. | |
lineCap | Type: butt, round or square ()Controls the method of how the ends of lines are drawn:- butt: Squares off the ends of a line at the exact endpoint of the line. - round: Rounds off the ends of a line by filling half a circle centered on the line’s endpoints. The radius for these rounded corners is equal to one-half the line width. - square: Squares off the ends of a line by extending the line a distance of one-half the line’s width beyond the endpoints. | |
Circle
Circle style properties control how circles get rendered on a map. Use these properties in conjunction with fill and stroke above to define the style for a circle layer.
circle: {
	radius: number;
}| Option | Description | Default |
|---|---|---|
radius | Type: number ()Radius of the circle in points. | |
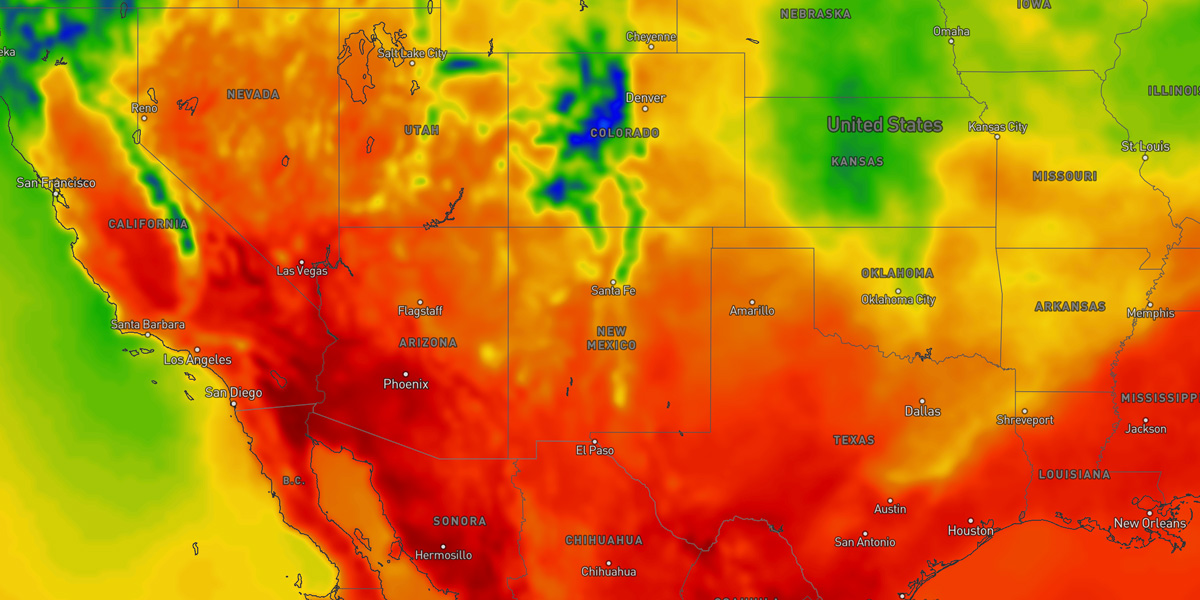
Sample
Sample style properties control how encoded data gets rendered on a map. Sample rendering is performed by sampling values from the underlying data and mapping it to a desired result, such as color fill, contour line, etc.
sample: {
	expression: 'number' | 'vector' | 'sum' | 'diff';
	channel: 'r' | 'g' | 'b' | 'a' | 'rg' | 'gb' | 'rb' | 'ra' | 'ga' | 'ba' | 'rgb' | 'gba' | 'rgba';
	quality: DataQuality;
	interpolation: InterpolationMode;
	smoothing: number;
	colorscale: Partial<ColorScaleOptions>;
	multiband: boolean;
	offset: number;
	meld: boolean;
	drawRange: { min: number; max: number; };
}| Option | Description | Default |
|---|---|---|
expression | Type: number, vector, sum, or diff ()Determines how data should be sampled from the encoded data texture:- number: Value is a float sampled from a single band. - vector: Value is a vector sampled and calculated from two bands. - sum: Value is a float sampled and calculated as the sum of two bands. - diff: Value is a float sampled and calculated as the difference of two bands. | |
channel | Type: string ()Color band(s) to sample from the encoded data. If performing an expression operation, such as vector, sum or diff, then two bands must be provided. | |
quality | Type: DataQuality ()Controls the data resolution that gets requested by the layer’s data source and rendered to the map. Data will be interpolated when rendering to the map to ensure low resolution/quality data is still smooth. Supported data quality values include:- exact: Data tiles will be requested and rendered 1:1 with map tiles and zoom level. This setting results in the highest data resolution but the lowest bandwidth and rendering optimization. - high: Data will be scaled slightly to share the same data tiles across 1 or 2 map zoom levels. - medium: Data will be minimally scaled resulting in slightly higher data resolution than normal at some map zoom levels.- normal: Data will be scaled to share the same data tiles across multiple map zoom levels. This setting provides a good balance between data resolution and reduced request bandwidth and rendering performance. - low: Data will be moderately scaled resulting in slightly less data resolution than normal at some map zoom levels.- minimal: Data will be scaled extensively to share the same data tiles across 3-5 map zoom levels. This results in drastically reduced data resolution but the highest bandwidth and rendering optimization. | |
interpolation | Type: InterpolationMode ()Type of interpolation to perform on the data. Supported data interpolation values include:- none: Disables interpolation and renders the data at its native resolution, which will often result in blocky and pixelization. - bilinear: Renders data using bilinear interpolation which is the most performance but often results in artifacts and blockiness depending on the data. - bicubic: Renders the data using bicubic interpolation which provides the smoothest output. - biquadratic: Renders the data using biquadratic interpolation which can result in better output than bilinear. This interpolation value is rarely used in favor of bicubic. | |
smoothing | Type: number ()Amount of smoothing to apply on the data from 0 (no smoothing) to 1 (full smoothing). Increasing this value is useful for low resolution data sets or when higher detail is not desired or needed. | |
colorscale | Type: ColorScaleOptions ()Defines how raster data is colorized. See the color scale configuration reference for the supported options. | |
offset | Type: number ()Normalized amount to shift the interpolated sample values from 0 to 1. This is typically used for expression operations like diff where interpolated values can be negative and you need to start values half way (0.5) between the colorscale.range. | |
meld | Type: boolean ()Whether data should be interpolated between intervals during animation playback. If true, then data will smoothly transition between data intervals, otherwise the result will appear stepped. | |
drawRange | Type: { min: number; max: number; } ()Limits the data range that should be rendered from the sampled data. If not provided, then the full data range will be rendered by default. | |
Grid
Grid style properties control how gridded content gets rendered on a map. Grid layers will render a grid of symbols or text in a grid layout and sample underlying encoded data at each grid point to determine how each symbol is displayed. Symbol instances rendered at grid points are projected in screen space, not map space, which means they will remain the same size on screen regardless of map zoom level.
grid: {
	spacing: number;
}| Option | Description | Default |
|---|---|---|
spacing | Type: number ()Spacing between grid points at whole number map zoom levels (e.g. 3, or 10, not 3.487). A lower spacing value will result in a higher density of symbol instances. | |
Since a grid layer simply renders a series of symbol instances in a grid format, see the symbol style options as well for controlling what gets rendered.
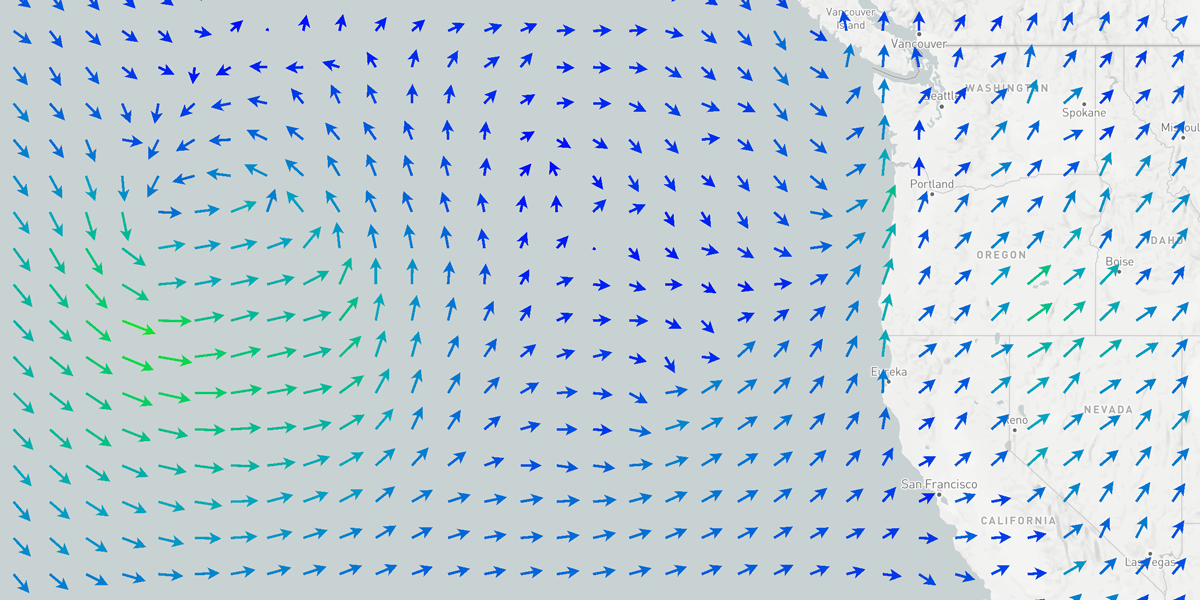
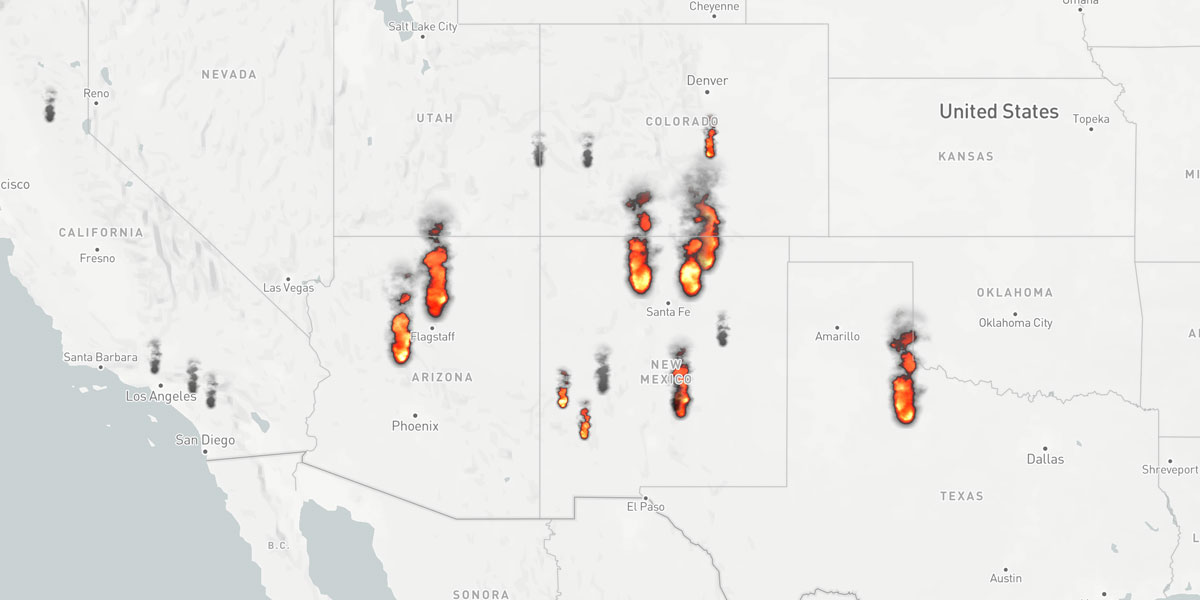
Particle
Particle style properties control how flow field particles get rendered on a map. Particles are used to represent vector data and flow fields, such as wind speed and direction or ocean waves and currents.
particle: {
	type: 'circle' | 'bar';
	count: number;
	density: ParticleDensity;
	size: number;
	speedFactor: number;
	trails: boolean;
	trailsFadeFactor: number;
	dropRate: number;
	dropRateBump: number;
}| Option | Description | Default |
|---|---|---|
count | Type: number ()Total number of particles to render for a single particle tile where a single particle tile is typically used for the visible map region. Keeping this value as a power-of-two will result in the best performance (e.g. 1024, 4096, 16384, 65536 or 262144. | |
density | Type: ParticleDensity ()An alternative to count that controls the total number of particles to render. Where count will always show the same number of particles regardless of map viewport size, density will automatically calculate the number of particles based on the viewport size in order to maintain a relatively consistent density across viewports and screen sizes. Supported density values include:- count: Falls back to the count value.- minimal: Least amount of particles will be rendered. This density setting may not provide enough speed and direction information on the map since coverage is minimal. - low: Slightly less particle density than normal, allowing the most visibiilty to content underneath while providing good speed and direction information.- normal: Provides a good amount of particles and speed and direction information while still allowing a good portion of content underneath to remain visible. - high: Slightly higher particle density than normal while still allowing some content underneath to remain visible.- extreme: Highest density that will essentially fill the layer with particle data, preventing content underneath from being visible. Note that overall map performance may be affected with this setting for some hardware configurations. | |
size | Type: number ()Size of the particles in screen points. | |
speedFactor | Type: number ()Speed factor of the particle movement. A value of 1 will use the default speed. | |
trails | Type: boolean ()Whether or not particle trails should be rendered. If false, then only the particles and their current positions will be rendered. | |
trailsFadeFactor | Type: number ()Amount particle trails should fade between frames between 0 and 1. A higher value will result in particle trails fading out slowly and longer trails, whereas lower numbers will result in shorter trails. | |
dropRate | Type: number ()Rate at which a particle will restart at a random position to avoid degeneration. A higher drop rate will result in faster repositioning and less overall movement. | |
dropRateBump | Type: number ()Factor applied to the dropRate and calculated velocity to further control the overall particle drop rate. | |
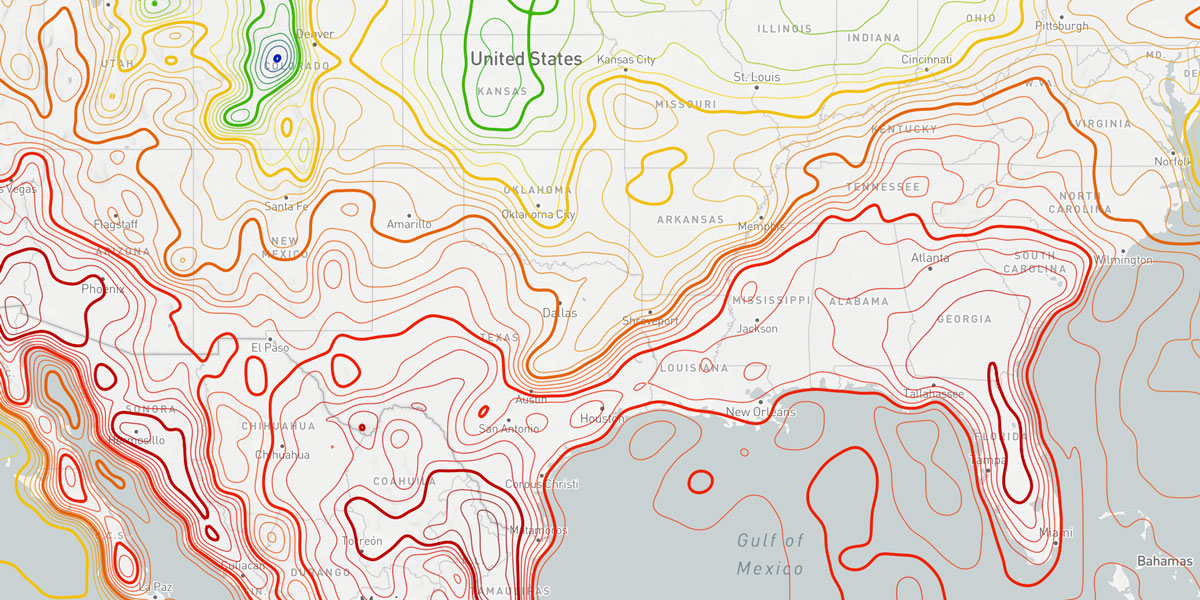
Contour
Contour style properties control how contoured data gets rendered on a map. Contour layers are rendered by sampling encoded data and interpolating values in real-time.
contour: {
	interval: number;
	majorInterval: number;
}| Option | Description | Default |
|---|---|---|
interval | Type: number ()Determines the value interval for which to draw contour lines for. This value must be in the same units as the data source. | |
majorInterval | Type: number ()Determines the value interval for which to draw major, or thicker, contour lines for. If this value is 0, then major contour lines will not be rendered. This value must be in the same units as the data source. | |
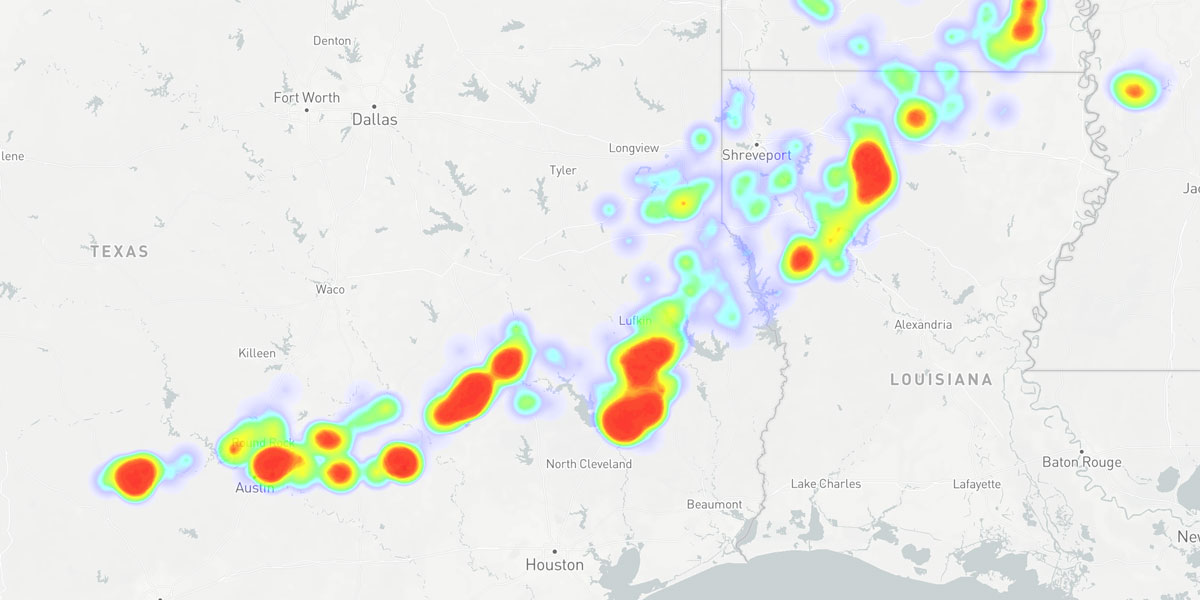
Heatmap
Heatmap style properties control how the density of points in an area gets rendered on a map.
heatmap: {
	color: Array<number | string>';
	radius: number;
	blur: number;
	intensity: number;
	weight: number;
	opacity: number;
}| Option | Description | Default |
|---|---|---|
color | Type: Array<number | string> ()Defines the normalized (0 to 1) color scale used to color pixels based on its density value, where 0 is none and 1 being the highest density. | |
radius | Type: number ()Radius of influence of each data point in screen points. | |
blur | Type: number ()Controls how much to fade out the edges of each point based on its radius, reducing its overall influence on neighboring points. | |
intensity | Type: number ()Value that is multiplied with the weight value to calculate the final weight of a point. A value larger than 1 biases the output color towards the higher end of the color scale, whereas a value less than 1 biases the output color towards the lower end of the color scale. | |
weight | Type: number ()Amount of weight to give each point. | |
The default color scale used for the color property is:
[
    0, 'rgba(0, 0, 0, 0)',
    0.2, 'rgba(0, 0, 255, 0.2)',
    0.45, 'rgba(0, 255, 0, 0.5)',
    0.85, 'rgba(255, 255, 0, 1)',
    1, 'rgba(255, 0, 0, 1)'
]
Icon
Symbol style properties control how icons, glyphs or instanced geometries get rendered on a map. Custom WebGL fragment shader programs can be provided for highly custom visualizations and effects for each instance on the map.
icon: {
	image: string | { id: string; url: string; sdf?: boolean; };
	atlas: { ids: Array<string>; interval?: number; };
	size: { width: number; height: number; };
	anchor: 'top-left' | 'top' | 'top-right' | 'left' | 'center' | 'right' | 'bottom-left' | 'bottom' | 'bottom-right';
	offset: { x: number; y: number; };
	padding: number | [number, number];
	rotation: number;
	animated: boolean;
	shader: string;
	shaderOnBeforeCompile: (shader: { vertex: string; fragment: string }) => void;
	uniforms: Record<string, any>;
	factor: number;
}| Option | Description | Default |
|---|---|---|
image | Type: string or { id: string; url: string; sdf?: boolean; } ()Image identifier of the image from the style manager to use for the symbol, or an object containing an id and url for remote images. For remote images, id is the identifier to cache the image as and url is the full URL to the remote image. Optionally, an sdf boolean can be provided to indicate if the image is a signed distance field (SDF) image. | |
atlas | Type: { ids: Array<string>; interval?: number; } ()Defines an atlas of icons as an array of image identifiers from the style manager. An optional interval can be provided to control which identifier index from the array is used for certain value ranges (typically for encoded raster datasets). | |
size | Type: { width: number; height: number; } ()Size of the symbol in screen points. | |
anchor | Type: top-left, top, top-right, left, center, right, bottom-left, bottom, or bottom-right ()Determines the origin point of the symbol relative to the feature’s anchor point. | |
offset | Type: { x: number; y: number; } ()Symbol translation relative to its anchor point in screen points. | |
padding | Type: number or [number, number] ()Margin size to apply around the symbol bounding box to use for detecting collisions, in points. If a single value is provided, then the same margin size will be applied to all sides of the symbol bounding box. If an array of two values is provided, then the first value will be applied to the left and right sides of the symbol bounding box, and the second value will be applied to the top and bottom sides of the symbol bounding box. | |
rotation | Type: number ()Symbol rotation in radians. Rotation will take place around the symbol’s configured anchor point. | |
animated | Type: boolean ()Whether the symbol is animated. For performance optimizations, only set this to true if you are using a custom shader program that requires animation. | |
shader | Type: string ()A custom WebGL fragment shader used to render the symbol. | |
uniforms | Type: Record<string, any> ()An object containing a set of uniforms and their values when using a custom shader for rendering the symbol. | |
factor | Type: number ()A value that can be assigned per instance based on the underlying data for that instance. This value is assigned as a uniform for the WebGL program and can be used in custom shaders to customize rendering based on each instance’s factor value. | |
Text
Text style properties control how text gets rendered on a map from vector features. Use these properties on conjunction with symbol to define the style for a text layer.
text: {
	value: string | {
		property: string | Array<string>;
		transform?: (value: string | number, units?: string) => string | number;
	};
	size: number;
	font: string;
	weight: 'normal' | 'bold';
	color: string | Color;
	outlineColor: string | Color;
	opacity: number;
	align: 'left' | 'center' | 'right';
	transform: 'none' | 'uppercase' | 'lowercase' | 'capitalize';
	anchor: 'top-left' | 'top' | 'top-right' | 'left' | 'center' | 'right' | 'bottom-left' | 'bottom' | 'bottom-right';
	offset: { x: number; y: number; };
	rotation: number;
	letterSpacing: number;
	lineHeight: number;
	maxWidth: number;
}| Option | Description | Default |
|---|---|---|
value | Type: string or { property: string | Array<string>; transform?: (value: string | number, units?: string) => string | number; } ()Text value to render for each feature. If a string is provided, then that string will be rendered for each feature. If an object is provided, then the property key will be used to extract the text value from the feature’s properties. Optionally, a transform function can be provided to transform the extracted value before rendering. | |
size | Type: number ()Font size in screen points. | |
font | Type: string ()Font family to use for rendering the text. Only built-in font families are supported and currently includes: Inter. | |
weight | Type: 'normal' or 'bold' ()Font weight to use for rendering the text. | |
color | Type: string or Color ()Color of the text label. | |
outlineColor | Type: string or Color ()Color of the text label outline. If no outline color is provided, then no outline will be rendered (default). | |
opacity | Type: number ()Opacity of the text label. | |
align | Type: 'left', 'center', or 'right' ()Horizontal alignment of the text label within its bounding box. | |
transform | Type: 'none', 'uppercase', 'lowercase', or 'capitalize' ()Text transformation to apply to the text label. | |
anchor | Type: 'top-left', 'top', 'top-right', 'left', 'center', 'right', 'bottom-left', 'bottom', or 'bottom-right' ()Determines the origin point of the text label relative to the feature’s anchor point. | |
offset | Type: { x: number; y: number; } ()Text translation, either positive or negative, relative to its anchor point in screen points. | |
rotation | Type: number ()Text rotation in degrees. Rotation will take place around the text’s configured anchor point. | |
letterSpacing | Type: number ()Amount of letter tracking to apply between each letter in the text label. | |
lineHeight | Type: number ()Amount of leading (spacing) to apply between each line in the text label. | |
maxWidth | Type: number ()Maximum width in screen points for the text label. If the text label exceeds this width, then the text will be wrapped to the next line. | |
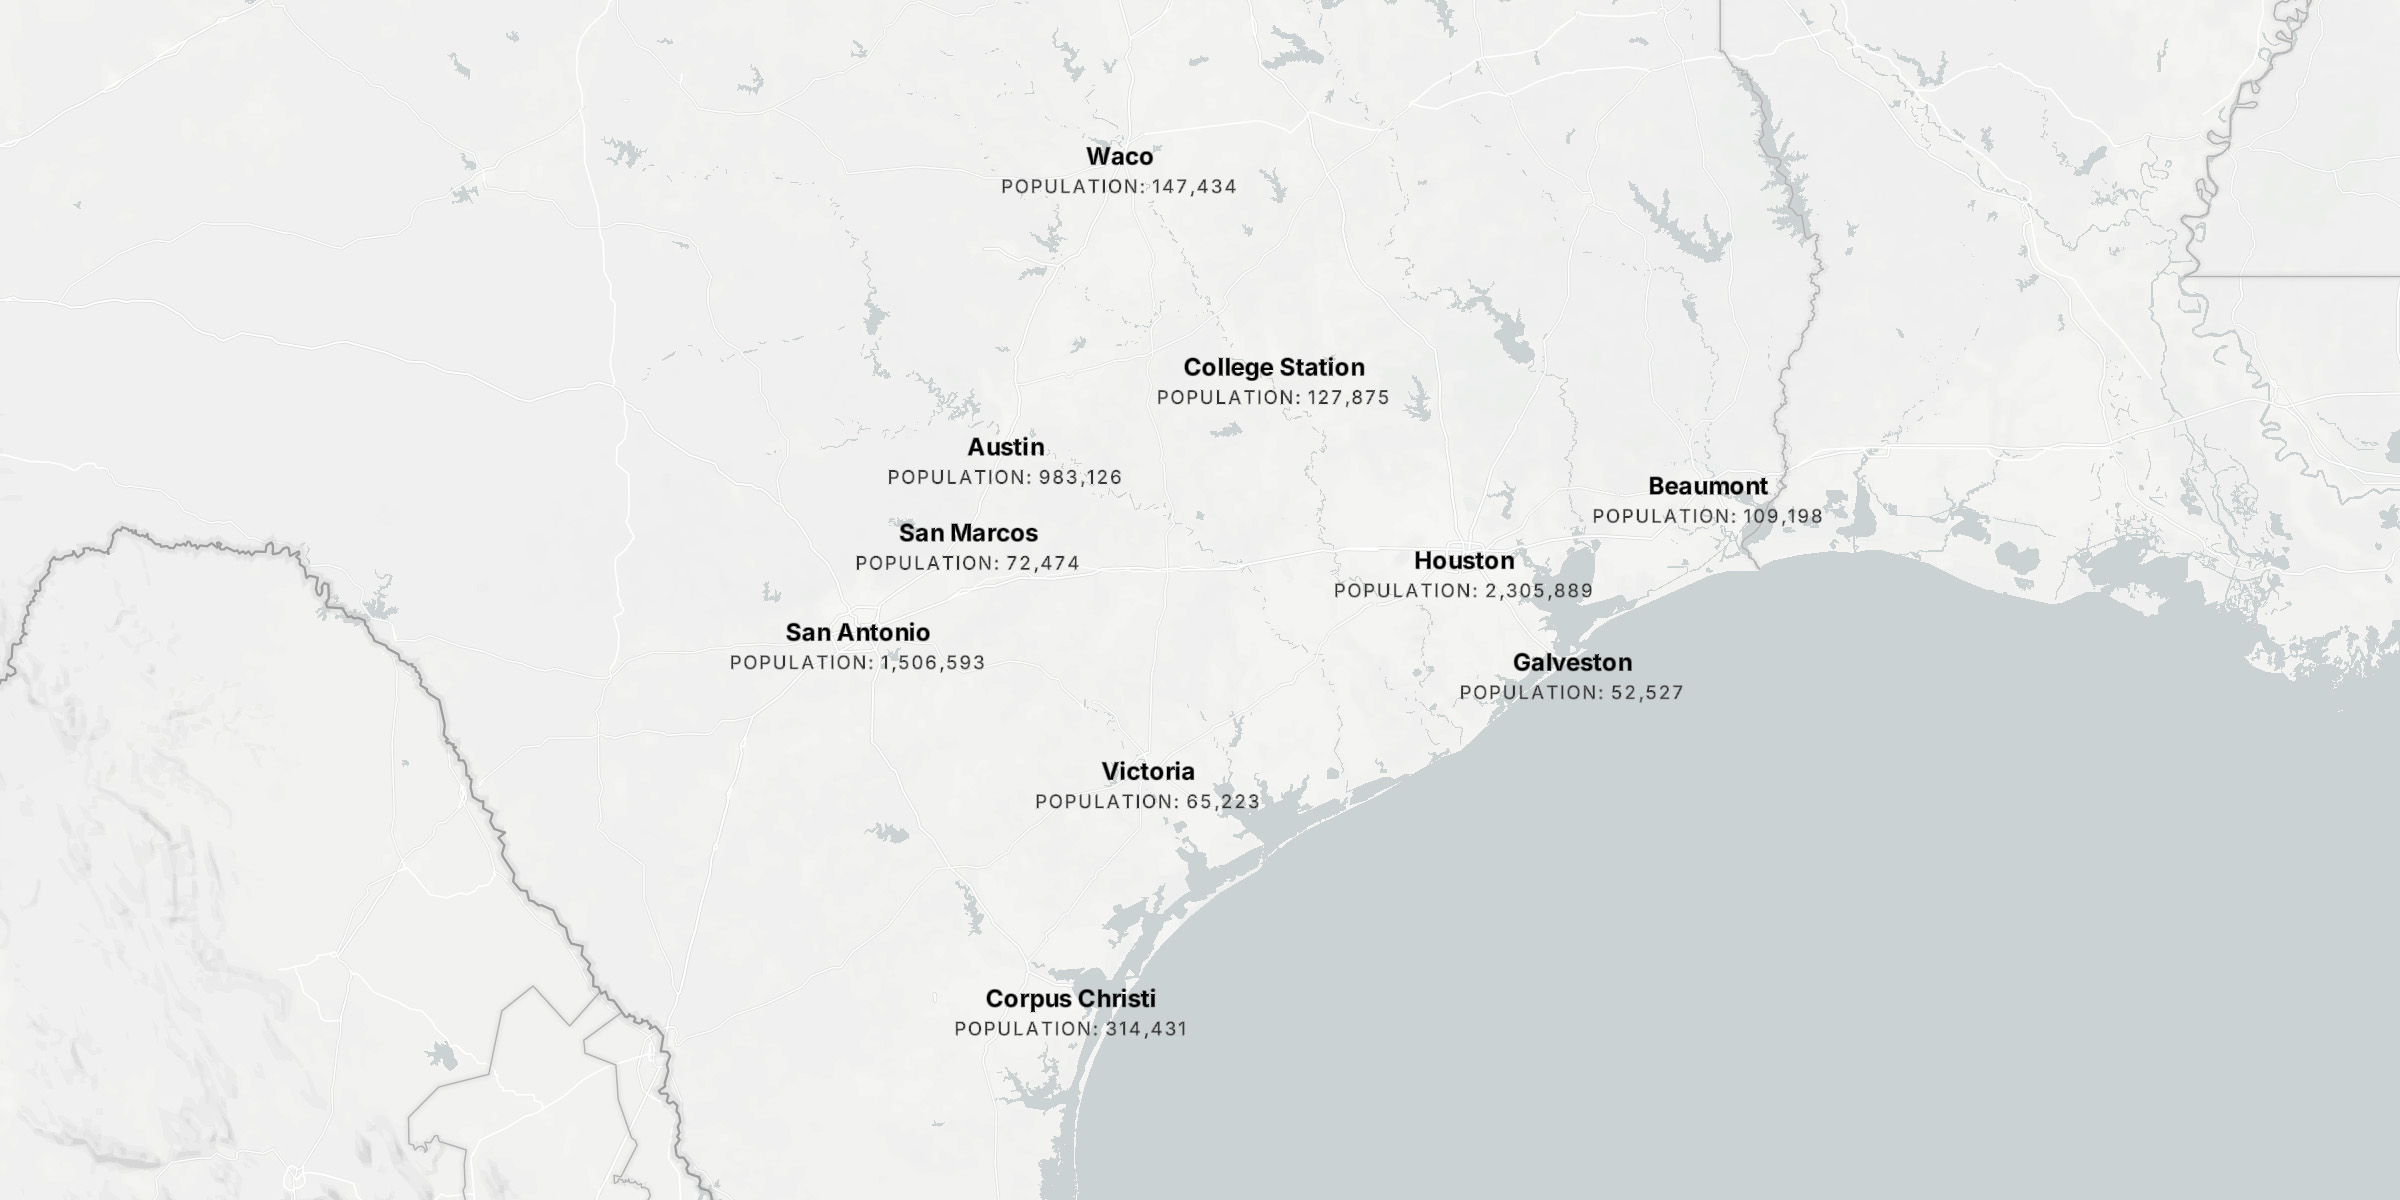
Multiple text labels per feature
Multiple text labels can be rendered for a single feature by providing an array of text style objects in the text property of the layer’s paint object. Each text style object should contain the same properties as a single text style object, but with different values for each text label. This is useful for rendering multiple data-driven text labels for a single feature, such as a city name and population, where each can be configured with different styles:
text: [
	{
		value: {
			property: 'name'
		},
		size: 13,
		weight: 'bold',
		align: 'center',
		anchor: 'center'
	},
	{
		value: {
			property: 'population',
			transform: (value) => {
				const pop = value.toString().replace(/\B(?=(\d{3})+(?!\d))/g, ",");
				return `Population: ${pop}`;
			}
		},
		size: 10,
		color: '#333',
		transform: 'uppercase',
		anchor: 'top',
		offset: { x: 0, y: 10 },
		letterSpacing: 0.1
	}
]
Symbol
Symbol style properties are applied to icon and text elements and control how they get placed on a map. These properties include controlling whether symbols can overlap with each other and/or other layer symbols, how they pitch and rotate with the map, etc.
symbol: {
	key: string;
	rank: string | { property: string; direction: 'asc' | 'desc'; };
	fadeOpacity: boolean;
	pitchWithMap: boolean;
	rotateWithMap: boolean;
	sizeAttenuation: boolean;
	allowOverlap: boolean;
	overlapMode: 'layer' | 'map';
}| Option | Description | Default |
|---|---|---|
key | Type: string ()Key to use for identifying the symbol across multiple tiles. This is useful for ensuring that the same symbol is rendered consistently across tiles. If not provided, then the symbol will be rendered based on the feature’s text value or some other property of the feature. | |
rank | Type: string or { property: string; direction: 'asc' | 'desc'; } ()Feature property value to determines the order in which the symbol should be rendered when performing collision detection. Features with higher rank values will be rendered first with a lower chance of colliding with other features. | |
fadeOpacity | Type: boolean ()Whether the symbol should fade in and out when placed on the map or based on collision detection with other symbols. | |
pitchWithMap | Type: boolean ()When true, the symbol will be pitched with the map. Otherwise, the symbol will always be oriented up when the map is pitched. | |
rotateWithMap | Type: boolean ()When true, the symbol will be rotated with the map so that it aligns with the map’s east/west axis. Otherwise, the symbol will always face the camera. | |
sizeAttenuation | Type: boolean ()When true, the symbol will be scaled based on its distance from the camera. This is useful for scaling symbols based on their distance from the camera so that symbols are smaller when they are further away and larger when they are closer when the map is pitched. | |
allowOverlap | Type: boolean ()Whether to disable collision detection and allow symbol to overlap with other symbols on the map. Defaults to false. Use this in conjunction with overlapMode to control the behavior of symbols when they overlap with other symbols. | |
overlapMode | Type: layer or map ()Determines how symbols should be rendered when they overlap with other symbols and allowOverlap is false:- layer: Symbols from this layer will not be allowed to overlap with other symbols from the same layer, but can overlap with symbols from other layers on the map. - map: Symbols from this layer will not be allowed to overlap with symbols from its nor all other layers on the map. | |