MapsGL - Using Legends
Legends are used to inform the user about what various colors and symbols in a visualization mean, especially when it comes to weather data. Alongside our built-in weather layers, the Xweather MapsGL SDK also includes pre-configured legends that correspond to each weather layer where applicable. You just need to add a legend control to your map controller and these weather legends will be added and removed for you automatically.
Legend Control
A legend control is responsible for managing the collection of legends currently visible within the context of an interface or map and provides the interface needed for adding and removing legends. A legend control is instantiated by your map controller instance using the addLegendControl method:
controller.addLegendControl('#map', {
    // configuration options...
});
This method takes two arguments: the DOM element into which the control is appended and a configuration object for the control. Refer to the legend control reference documentation for details on the available configuration options.
Once you’re set up a legend control with your map controller, then you’re ready to start adding legends. If you’re just using our built-in weather layers, then there’s nothing else you need to do as the necessary legends will be added and removed along with their respective weather layers. However, if you’re using weather layers with custom styling, then you may need to also provide a custom configuration for those legends so that the legend reflects your style overrides. Review the Custom Weather Styling section below.
Similar to adding weather layers, whenever you remove a weather layer, its respective legend will also be removed from the legend control. However, multiple weather layers may use the same legend. If this is the case, then the legend will only be removed when all weather layers that reference it have also been removed.
Custom Weather Styling
If you’re customizing the styling of one of the built-in weather layers, you may need to also override the default legend configuration for that layer. Currently this is only necessary for layers that use point legends since the legend items cannot be determined automatically using the layer’s paint style configuration. For layers that use a color scale bar legend, then the custom color scale and data range can be automatically detected from the layer’s style to update the legend configuration accordingly.
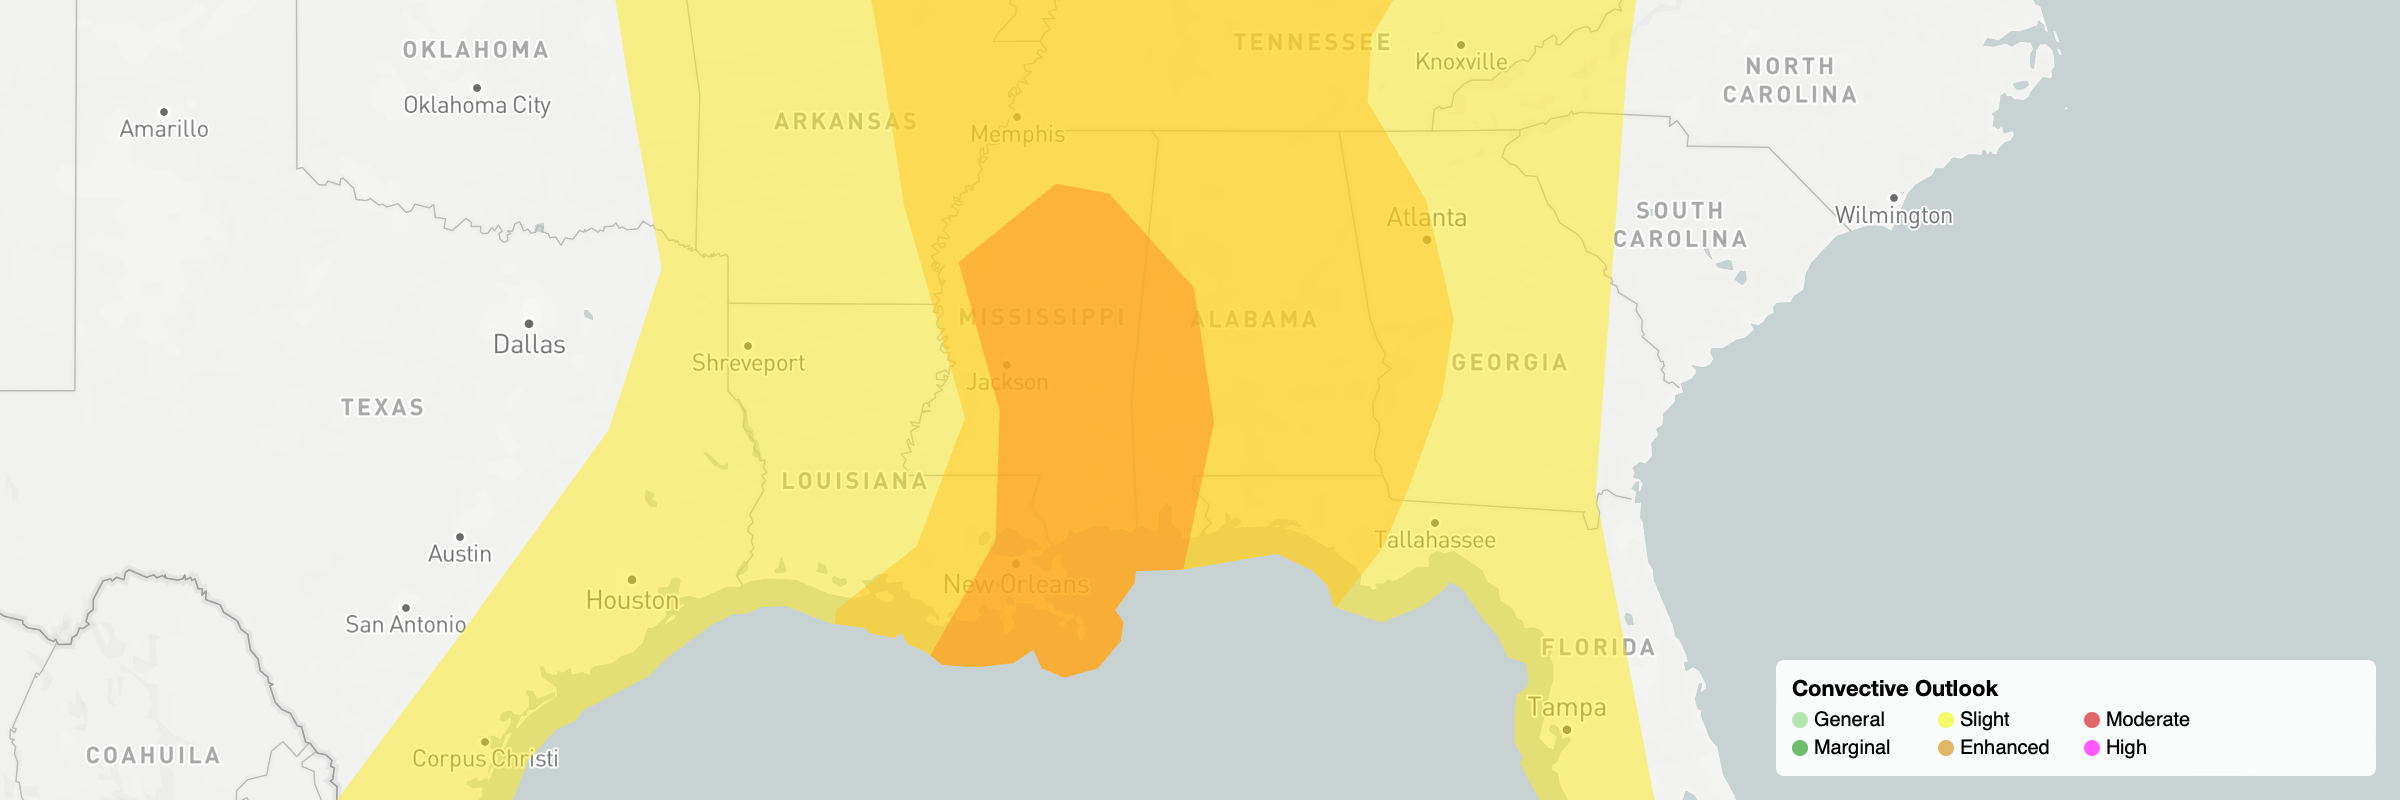
For example, we’ve customized the styling for the convective weather layer to use our own set of colors. Our configuration would be similar to:
controller.addWeatherLayer('convective', {
    paint: {
        fill: {
            color: (data) => {
                // define colors per category
                const colors = {
                    general: '#ffea16',
                    marginal: '#ffc41d',
                    slight: '#ff891d',
                    enhanced: '#fa2311',
                    moderate: '#fa23ec',
                    high: '#fac9eb'
                };

                // get the category for this feature
                const type = data.details.risk.type?.toLowerCase();

                return colors[type] || '#000000';
            },
            opacity: 0.7
        }
    }
});
However, reviewing our style changes on the map reveals that the legend that was added for us is still showing the default colors for the layer:
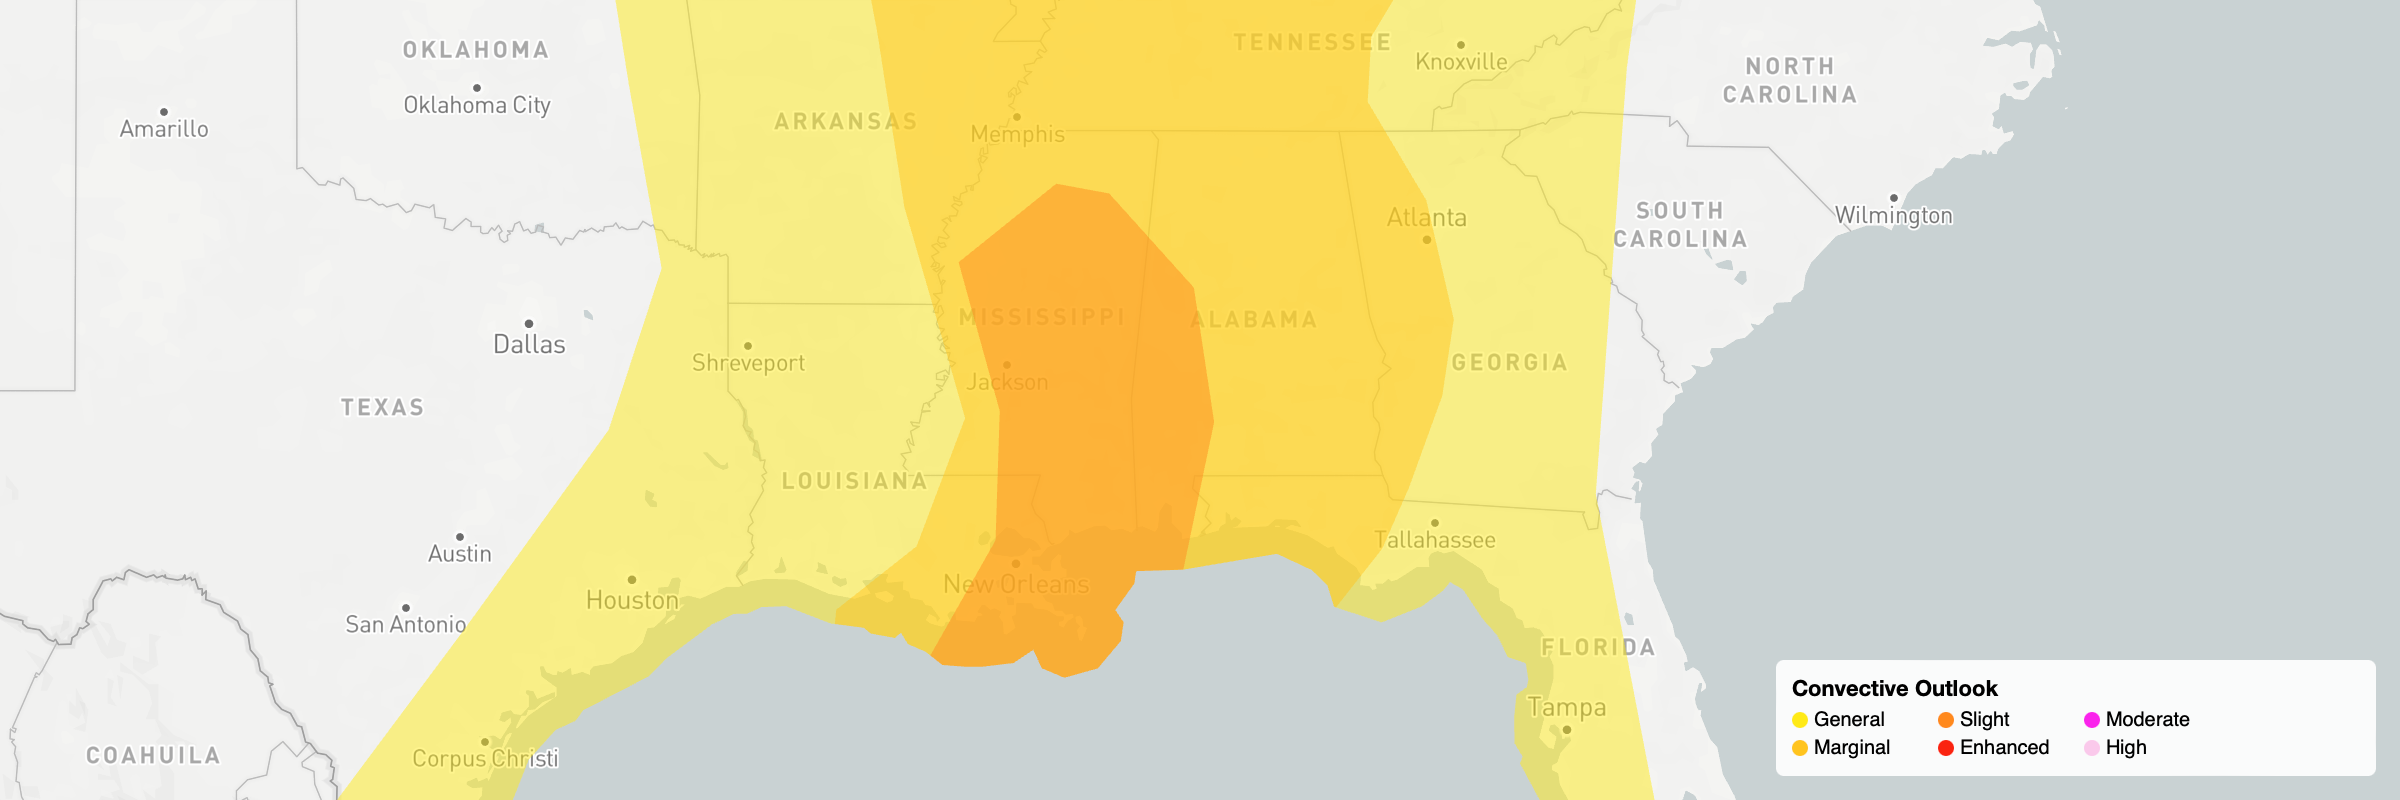
So we need to override the layer’s legend configuration when adding it to our map:
// define colors per category
const convectiveColors = {
    general: '#ffea16',
    marginal: '#ffc41d',
    slight: '#ff891d',
    enhanced: '#fa2311',
    moderate: '#fa23ec',
    high: '#fac9eb'
}

controller.addWeatherLayer('convective', {
    paint: {
        fill: {
            color: (data) => {
                // get the category for this feature
                const type = data.details.risk.type?.toLowerCase();

                return convectiveColors[type] || '#000000';
            },
            opacity: 0.7
        }
    },
    legend: {
        points: {
            values: [
                { color: convectiveColors.general, label: 'General' },
                { color: convectiveColors.marginal, label: 'Marginal' },
                { color: convectiveColors.slight, label: 'Slight' },
                { color: convectiveColors.enhanced, label: 'Enhanced' },
                { color: convectiveColors.moderate, label: 'Moderate' },
                { color: convectiveColors.high, label: 'High' }
            ]
        }
    }
});
The result is the legend rendered with our custom category colors:
Refer to the documentation on customizing weather layers for more information.
Custom Legends
If you are adding your own custom data sources and layers on your map, you may also need to show a legend for your data. The MapsGL SDK also allows you to create custom legends similar to the built-in weather layer legends but for your own data visualizations.
Refer to the advanced legends guide for more details and examples on creating custom legends.