MapsGL - Custom Legends
Legends provide insight behind the data of a visualization, defining what various colors and symbols mean for a particular data set. They are used in conjunction with renderer styles to tell a particular story about that data.
Adding Legends
In order to render your own legends, you’ll first need to set up a legend control which is responsible for managing and rendering a series of legends. This legend control can be added to your map or other part of your application interface.
The following example creates a LegendControl instance and adds it to the same DOM element as our map:
const control = new LegendControl({
    // control options...
});
control.addTo(document.getElementById('map'));
Once you’ve set up a legend control instance, you can add legends to it using the addLegend method.
There are two types of legends: bar and point. Refer to the legend reference documentation for the full list of supported configuration options for both legend types.
Bar Legends
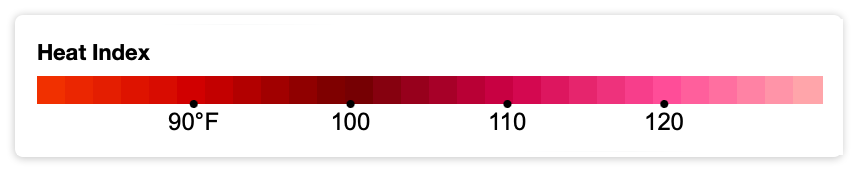
Bar legends consist of a horizontal color scale bar and are used to show data across a minimum and maximum value range.
For example, the following adds a legend representing heat index values on a map in the value range of 80 F (26.67 C) and 130 F (54.44 C) and labels underneath the color scale bar:
const legend = control.addLegend('heat-index', {
    type: 'bar',
    title: 'Heat Index',
    colorscale: {
        height: 14,
        rounded: false,
        range: {
            min: 26.67,
            max: 54.44
        },
        stops: [
            26.666666666667, '#f33300',
            32.222222222222, '#d00000',
            37.777777777778, '#720000',
            43.333333333333, '#ce0046',
            48.888888888889, '#ff4b98',
            54.44, '#ffadad'
        ],
        units: {
            data: 'C',
            metric: 'C',
            imperial: 'F',
            converter: (value, from, to) => {
                if (from === 'C' && to === 'F') return aerisweather.mapsgl.units.CtoF(value);
                if (from === 'F' && to === 'C') return aerisweather.mapsgl.units.FtoC(value);
                return value;
            }
        },
        labels: {
            every: (metric) => (metric ? 5 : 10), // use a different label interval for metric
            formatter: (value, index, state) => (
                index === 0 ? `${Math.round(value)}°%%units%%` : `${Math.round(value)}`
            ),
            placement: 'bottom',
            marks: 'point'
        }
    },
    text: {
        size: 12,
        color: '#000'
    }
});
Updating Bar Legends
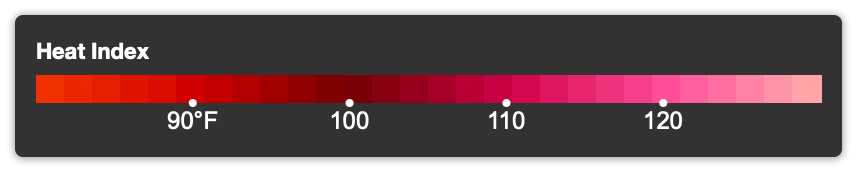
You can update an existing legend using the legend’s update method and passing in the configuration overrides you want to update the legend with.
For instance, if your application switches to some version of dark mode and changes the background of the LegendControl container to a dark color, you would need to update the legend text color to white as well:
legend.update({
    text: {
        color: '#fff'
    }
});
Or, you want to update the legend labels to categorize values in the range rather than show actual numerical values:
legend.update({
    colorscale: {
        labels: {
            normalized: true,
            values: [
                { value: 0, label: 'Uncomfortable' }, // left label
                { value: 0.5, label: 'Hot' }, // middle label
                { value: 1, label: 'Dangerous' } // right label
            ],
            marks: 'none'
        }
    }
});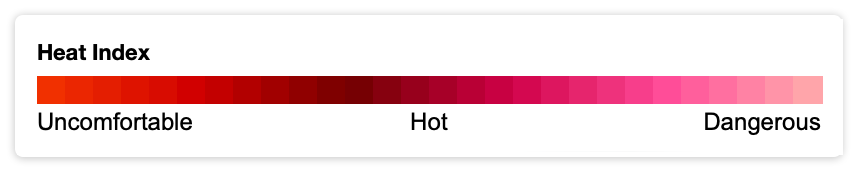
Note that in this last example we are setting colorscale.labels.normalzed to true since we are providing the label values in the range of 0 to 1 (0 being the left side of the bar and 1 being the right). If we had left this value as the default of false, then the labels would be placed in the value range defined in colorscale.range and no labels would render since their values between 0 and 1 are outside that range.
Point Legends
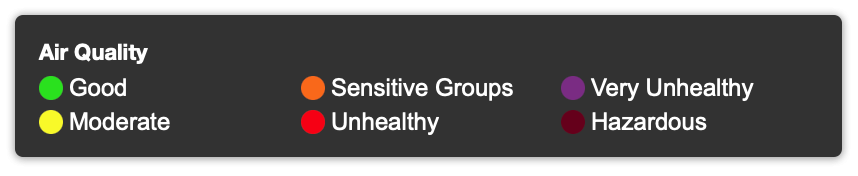
Point legends consist of symbols, colors and labels and are used to show categories, groups or types of data.
For example, the following configuration defines a legend for air quality, where values are categorized and plotted on the map as colored circles based on their level type:
const legend = control.addLegend('air-quality', {
    type: 'point',
    title: 'Air Quality',
    points: {
        radius: 6,
        values: [
            { color: '#29e11f', label: 'Good' },
            { color: '#f8f92a', label: 'Moderate' },
            { color: '#f9681b', label: 'Sensitive Groups' },
            { color: '#f60115', label: 'Unhealthy' },
            { color: '#7a2c83', label: 'Very Unhealthy' },
            { color: '#65001b', label: 'Hazardous' }
        ],
        margin: [3, 5]
    },
    text: {
        size: 12,
        color: '#000'
    }
});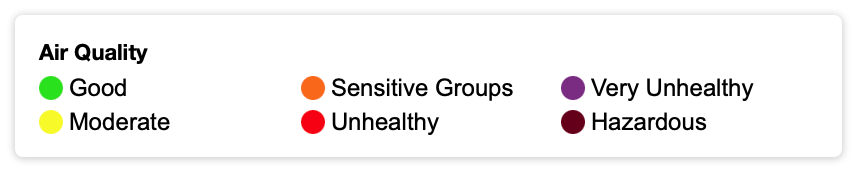
You can see in the above example how we are defining a color and label value for each item we want to display in the legend.
Updating Point Legends
As described above with bar legends, you can also update an existing point legend using its update method and passing in the configuration overrides you want to update the legend with. Here’s a similar example switching the text color to white for dark mode:
legend.update({
    text: {
        color: '#fff'
    }
});
Removing Legends
To remove a legend from a LegendControl instance, use the removeLegend method and provide the unique identifier you used when adding the legend originally:
control.removeLegend('air-quality');Note, however, that removeLegend may not always remove the legend instance from the control. That’s because a legend is only removed when the total number of references associated with it is zero. A legend’s reference count increments each time you call addLegend with the same unique identifier in order to prevent the same legend from being rendered multiple times in the case of multiple layers using the same layer.
If you must completely remove a legend instance regardless of the total number of remaining references, you can force its removal by passing true as the second argument:
control.removeLegend('air-quality', true);