MapsGL Android - Customizing temperature colors
This example configures the temperatures weather layer with a custom color scale and a color stop interval, so the fill draws as discrete bands rather than a smooth gradient. Color stops and intervals are provided in degrees Celsius to match the units the temperatures data source uses.
It is the Android port of the MapsGL JS Customizing temperature colors example. The complete activity ships in the MapsGL Android SDK demo as CustomTempsFillActivity.
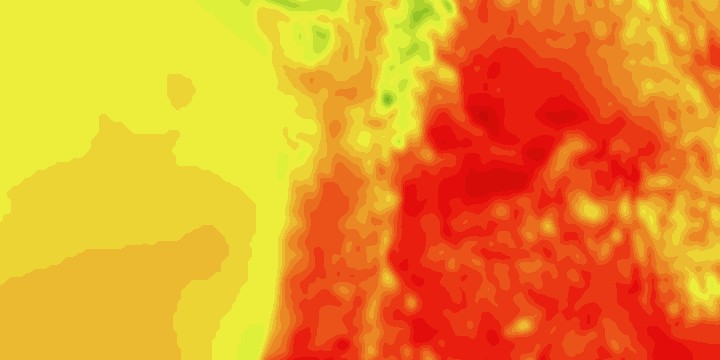
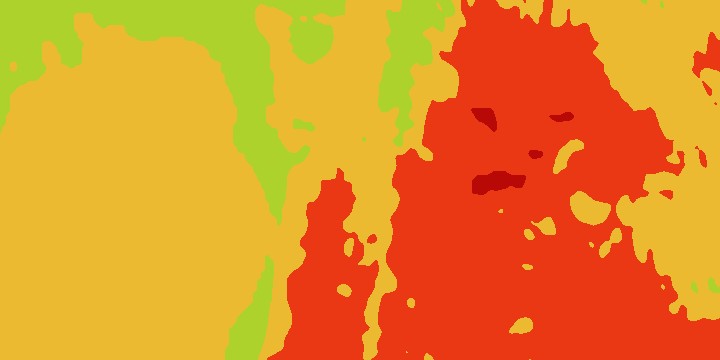
Banded fills
A smooth gradient is interval = 0.0 with interpolate = true, which is what the built-in temperatures configuration ships. Discrete bands set both a band width and interpolate = false:
paint.sample.colorScale = ColorScaleOptions(
    stops = CUSTOM_RAMP,
    interval = FtoCUnit(2.0),
    interpolate = false,
)
interval is the width of a band. interpolate = false keeps each band a flat color. The two screenshots are the same view with only that width changed. A wider interval snaps sampled values onto a coarser grid before the color lookup, so hues shift along with the edges.
The interval is a width, not a temperature
Stop values are Celsius, because that is what the temperatures source publishes. So is the interval — and converting a width is not the same as converting a reading:
import com.xweather.mapsgl.utils.FtoCUnit

interval = FtoCUnit(2.0)   // 1.11 C  — correct
interval = FtoC(2.0)       // -16.7   — wrong: subtracts the 32-degree offset
FtoC converts a temperature and applies the offset. A width is a difference, so only the scale factor applies, which is what FtoCUnit is for. Both live in com.xweather.mapsgl.utils.
The ramp
Straight from the JS example, in degrees Celsius:
val CUSTOM_RAMP = listOf(
    ColorStop(-60.0, "#FFFFFF"),
    ColorStop(-50.0, "#9C619B"),
    ColorStop(-40.0, "#58005b"),
    ColorStop(-30.0, "#ce00d7"),
    ColorStop(-20.0, "#121475"),
    ColorStop(-10.0, "#5b97f8"),
    ColorStop(0.0, "#81e8ff"),
    ColorStop(5.0, "#0f7001"),
    ColorStop(15.0, "#ecf93d"),
    ColorStop(25.0, "#e90f0b"),
    ColorStop(35.0, "#6b0001"),
    ColorStop(45.0, "#fff7e2"),
    ColorStop(50.0, "#7b7b7b"),
)
ColorStop color strings use #RRGGBB and #AARRGGBB. See the radar color scale example.
Applying the scale
Edit the configuration, add the layer, then pass the same scale to setPaintProperty. That call updates the fill and the legend together:
val config = WeatherService.Temperatures(controller.service)
val paint = (config.layer.paint as SampleLayerPaint).sample
val scale = ColorScaleOptions(
    stops = CUSTOM_RAMP,
    interval = FtoCUnit(2.0),
    interpolate = false,
)
paint.colorScale = scale
val layer = controller.addWeatherLayer(config) ?: return
controller.setPaintProperty(layer.id, "sample.colorscale", scale)
Use the same setPaintProperty call when a control changes the band width later.
Related
- Customizing radar color scale — the same sample-layer color scale API, swapped at runtime, plus the per-precipitation-type form
- Customizing wind particles — the same
SamplePaint, with normalized stops instead of real data values, plus the particle settings - Customizing the heat index legend — changing what a bar legend says about a scale rather than the scale itself