MapsGL Android - Data Inspector Control
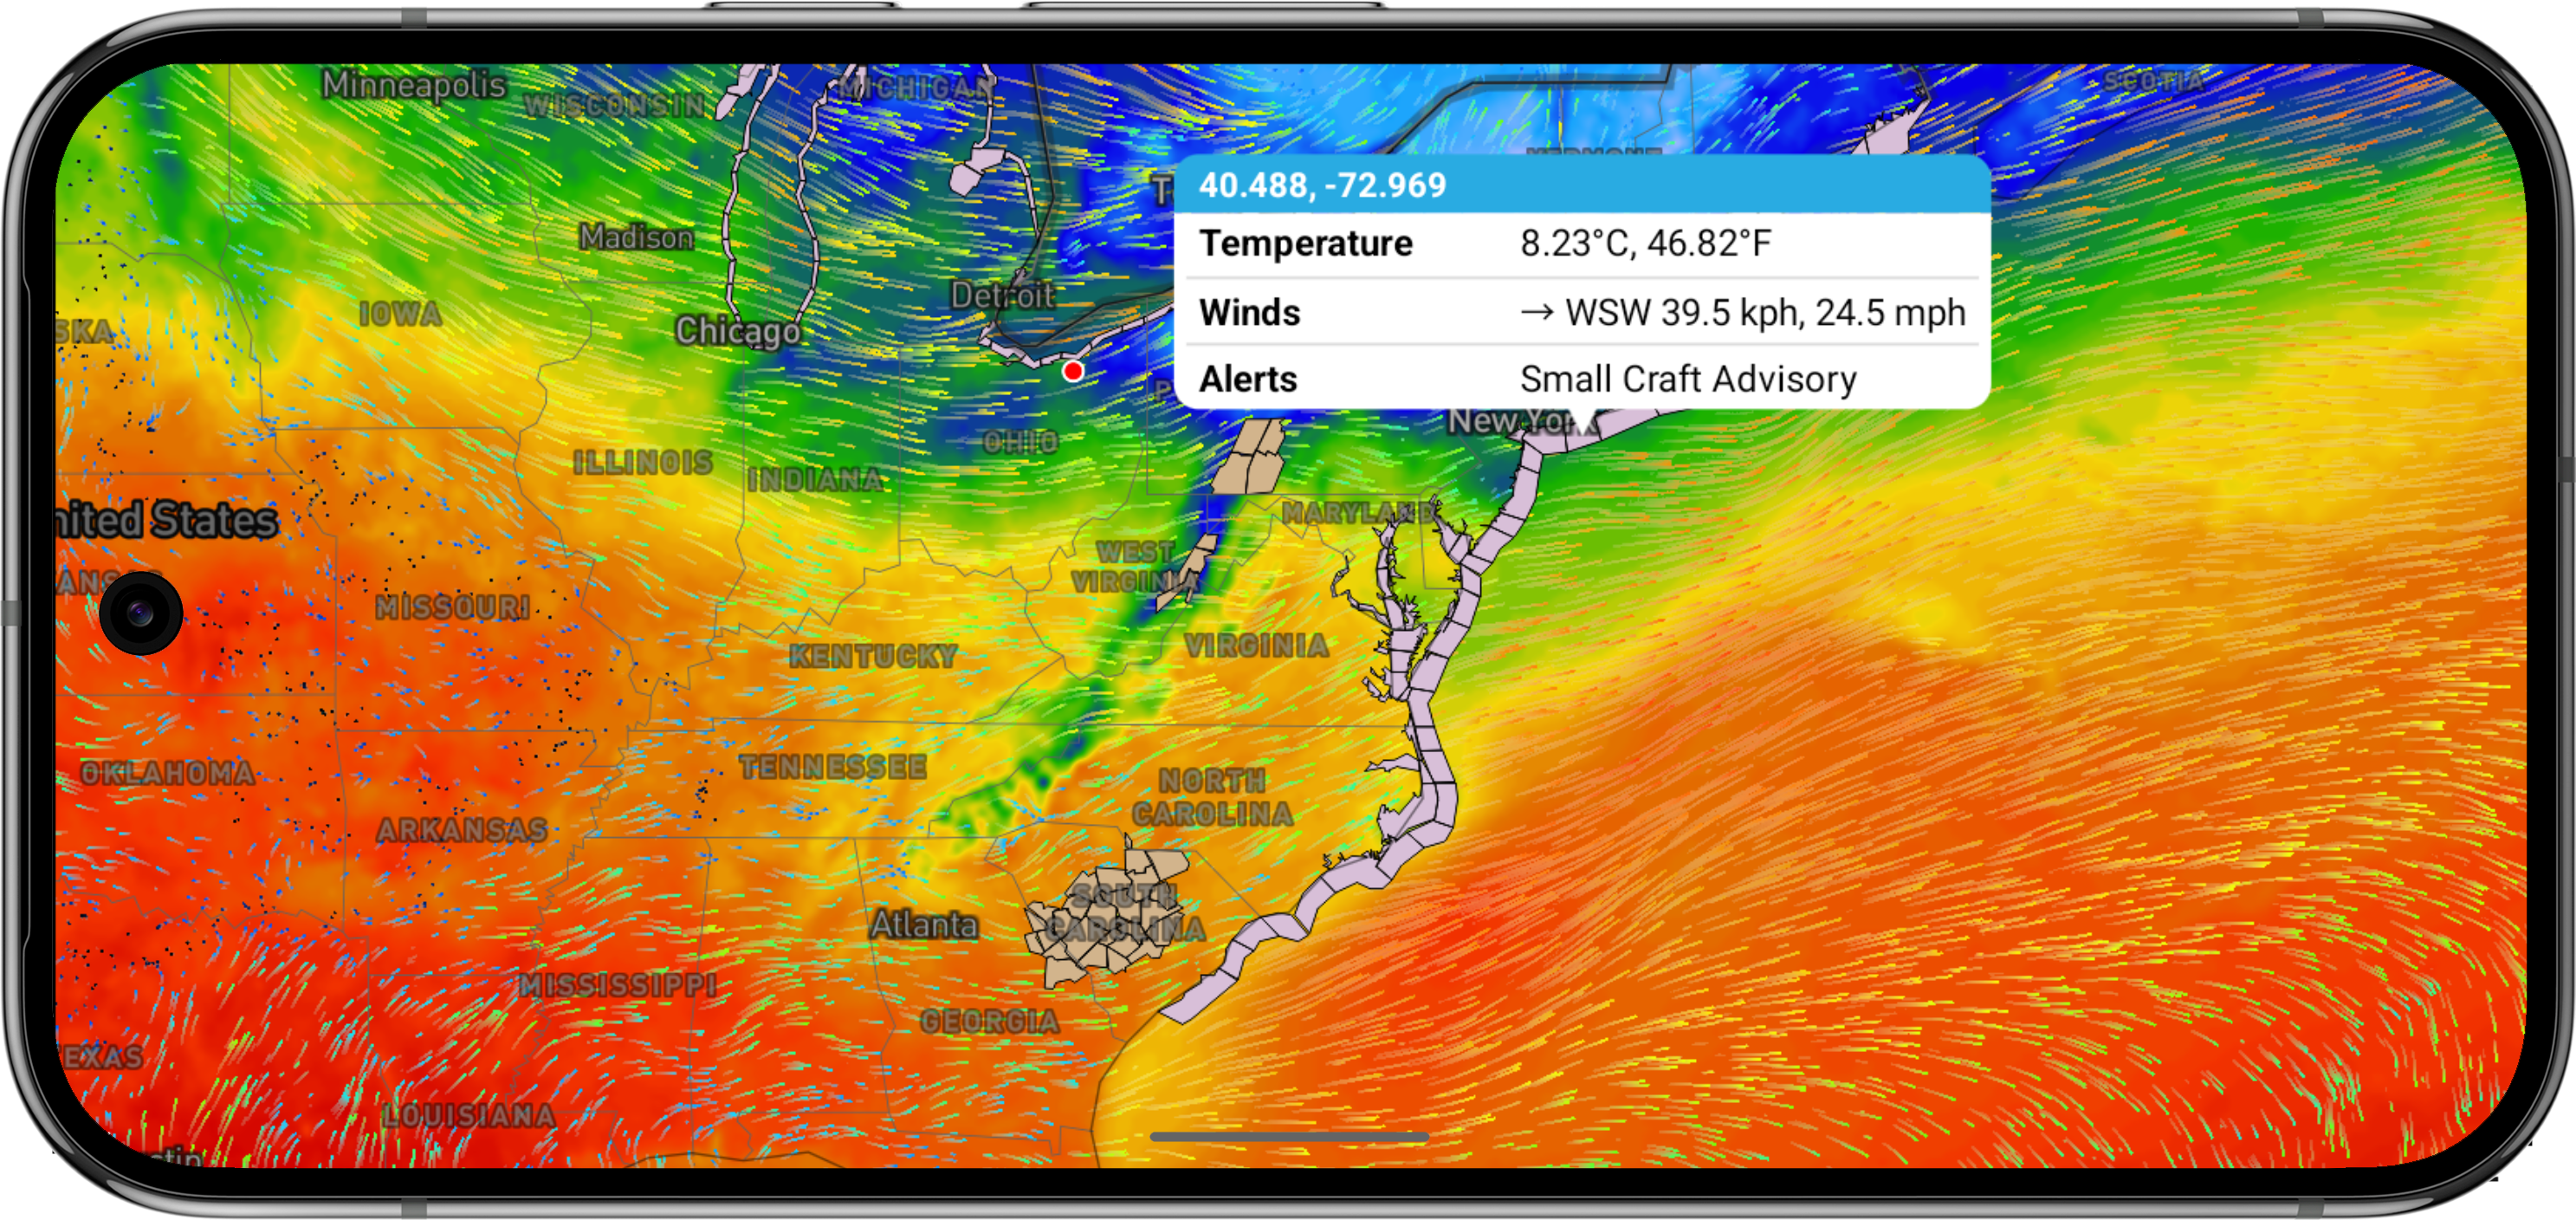
A data inspector control allows you to view the underlying data for each visible map layer that supports feature queries. It is configured to appear when the user clicks or taps on the map. When the control is visible, it will display a tooltip containing the data values for each layer at the current map coordinate.
You can add a data inspector control to your map using the addDataInspectorControl() method on the MapController instance. This method requires the host view to which the control will be inserted into and constrained to, typically the main map view instance. The method returns the created DataInspectorControl instance.
// Adds a data inspector control to the map, returning the control instance
val control = controller.addDataInspectorControl(mapView)

// Removes the data inspector control
controller.removeDataInspectorControl()
Refer to the DataInspectorControl API reference for more information about the available properties and methods.
Data Presentation
Data inspector controls use data presentations to format and display the data values for each layer. A data presentation consists of a title and a formatting function that takes the raw data value and returns a formatted string for display in the control. You can create custom data presentations to change how the data is shown to the user.
The MapsGL SDK already includes several built-in data presentation configurations associated with the available weather layers. However, you may want to override these in order to format the data values differently or provide additional content in the output. There are two ways to set custom data presentations for layers: including it when adding a weather layer to the map, or afterwards by setting it directly on the data inspector control.
Customizing via Weather Layer Overrides
When you add a weather layer to the map, you can optionally override the default configuration to customize the layer. For example, providing a custom data presentations for the .temperatures weather layer would be similar to:
val tempsConfig = WeatherService.Temperatures(mapController.service)

// Create custom data presentation for the layer
tempsConfig.presentation = Presentation(
    title = "Temperature (°F)", fn = { features ->

        // Encoded raster data values are always returned as Floats
        val featureMap = features as? Map<*, *>
            ?: return@Presentation ""

        // MapsGL data values are always in Metric units, with temperature in Celsius
        val tempC  = (featureMap["value"] as? Float)
            ?: return@Presentation ""

        // Return formatted output
        String.format("%.1f", Units.CtoF(tempC ))
    })

// Add the weather layer with the custom configuration
mapController.addWeatherLayer(tempsConfig)
Note that for the temperatures layer, the resulting value is a simple float value stored on the value key of the feature’s properties. However, some layers consist of multiple values, like those related to winds and other vector data. For these layers, the feature’s properties will contain values for both value and angle keys:
val windsConfig = WeatherService.WindSpeeds(controller.service)

// Create custom data presentation for the layer
windsConfig.presentation = Presentation(
    title = "Winds (mph)", fn = { features ->
        val featureMap = features as? Map<*, *>
            ?: return@Presentation ""

        val speedMs = (featureMap["value"] as? Float)
            ?: return@Presentation ""
        val angleDeg = (featureMap["angle"] as? Float)
            ?: return@Presentation ""

        // Stored angle is the direction wind is moving **to**, but with weather wind direction is the opposite **from** direction.
        // So reverse the angle for the wind direction in degrees.
        val fromAngle = angleDeg - 180

        // MapsGL data values are always in Metric units, with wind speed in meters per second
        val speedMph = Units.msToMph(speedMs)

        // Return formatted output
        "${String.format("%.1f", speedMph)}, ${String.format("%.0f", fromAngle)} degrees"
        })

// Add the weather layer with the custom configuration
controller.addWeatherLayer(windsConfig)
Customizing via the Data Inspector Control
Alternatively, you can change a layer’s data presentation after it has already been added to the map by setting it directly on the map’s data inspector control. Just use the setPresentation(for:presentation:) method on the control and provide the unique identifier for the layer you want to update and the data presentation configuration to want to use:
// Create a custom data presentation for the temperatures layer
val tempsPresentation = Presentation(
    title = "Temperature (°F)", fn = { features ->

    // Encoded raster data values are always returned as Floats
    val featureMap = features as? Map<*, *>
        ?: return@Presentation ""

    // MapsGL data values are always in Metric units, with temperature in Celsius
    val tempC = (featureMap["value"] as? Float)
        ?: return@Presentation ""

    // Return formatted output
    String.format("%.1f", Units.CtoF(tempC))
})

// Set the custom presentation on the data inspector control for the temperatures layer. We need to get the layer's
// identifier first based on the weather layer code.
controller.getWeatherLayer(LayerCode.TEMPERATURES)?.let { tempsLayer ->
     control.setPresentation(tempsLayer.id, tempsPresentation)
}