MapsGL Android - Data-Driven Styling
Many paint properties support data-based styling, which allows you to return different styling configurations based on the data for each feature or the map’s current state, such as zoom level. MapsGL supports Mapbox style expressions for data-driven styling, which can be used to reference data properties or evaluate custom functions to derive the style information for each feature.
Using Property Values
Sometimes your data source may provide the style information necessary for your layer and renderer type. This can often be the case when using vector or GeoJSON data sources where additional model data and properties are provided for each geospatial feature.
For example, our vector alerts tile set also includes information about each alert alongside its geometry data, such as the name of the alert, valid and expires times and the standard color used. If you wanted to render alerts and created your own vector tile data source, you can configure your fill.color paint property to reference the key path that corresponds to the property containing the color value to use.
To reference a feature’s property value, use the get style expression:
{
    property: ["get", "PROPERTY_KEY_PATH"]
}
For alerts vector tiles, each feature’s alert-related properties are given to us in the following structure:
{
    "ADVISORY": "FLOOD WARNING",
    "CAT": "flood",
    "COLOR": "00FF00",
    "EXPIREDATE": 1652270400,
    "LOCATION": "madison",
    "STARTDATE": 1652112060,
    "VTEC": "FL.W",
    "ZONE": "ILC119"
}
For rendering our data, we want to use the value from the COLOR property for each feature’s fill color:
val config = WeatherService.Alerts(controller.service) as WeatherLayerConfiguration<*, *>
val paint = config.layer.paint as FillLayerPaint

paint.fill =
    FillPaint(color = StyleValue.Expression(Expression.concat(listOf("#", Expression.get("COLOR")))))

paint.stroke =
    StrokePaint(color = StyleValue.Constant(toColor("#000")))

controller.addWeatherLayer(config)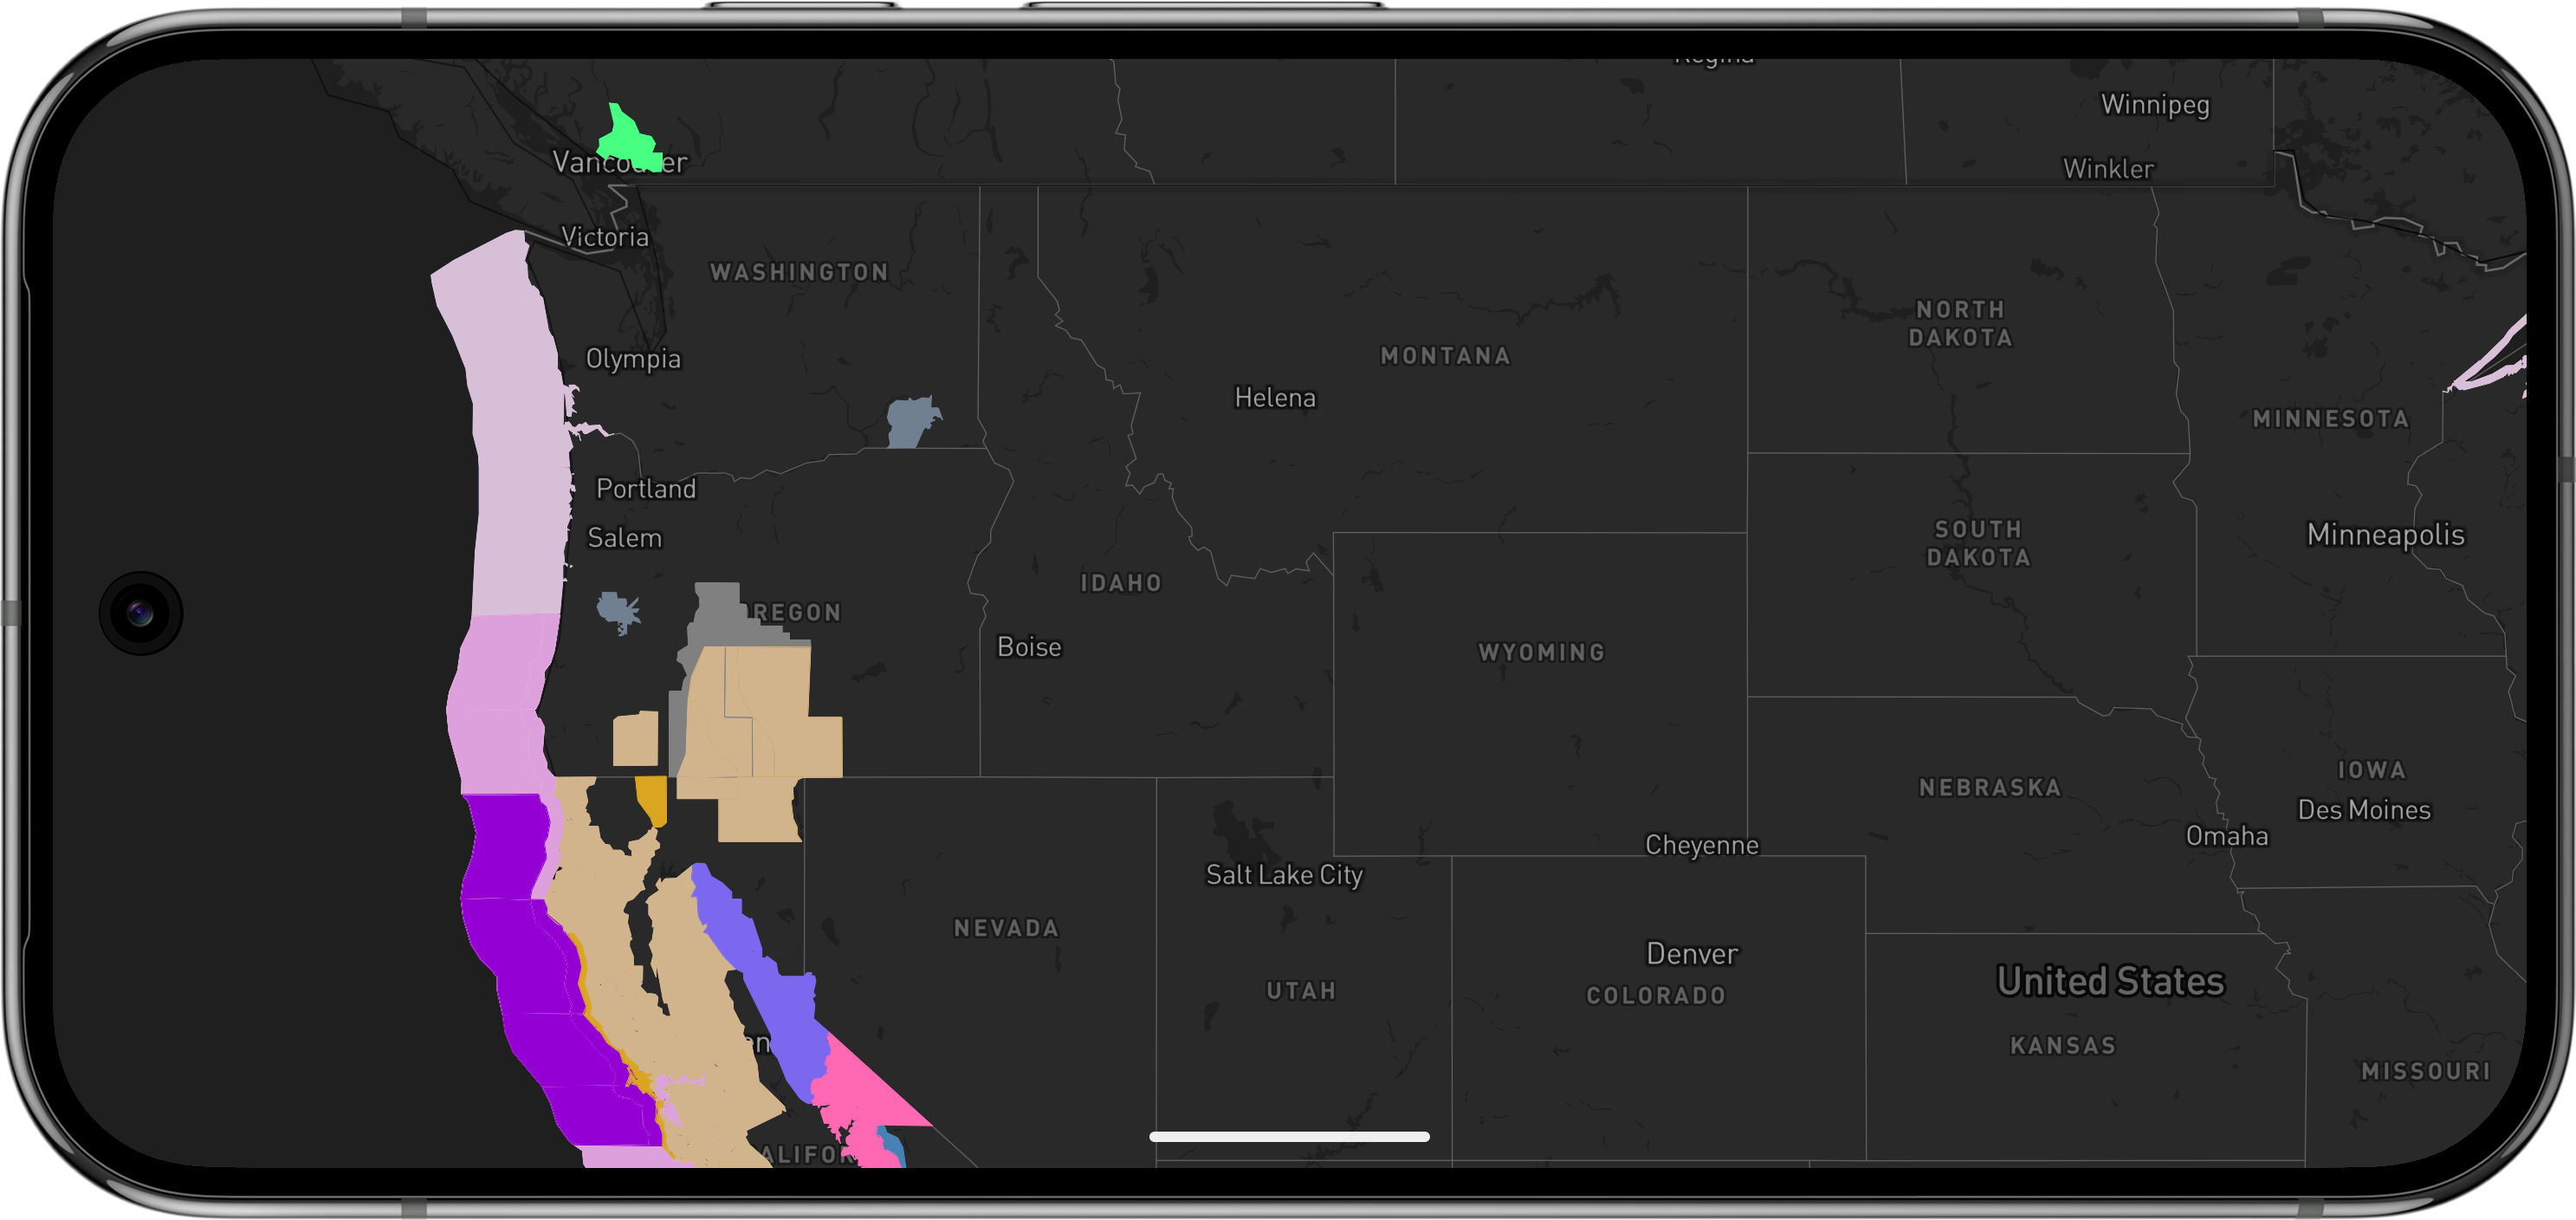
Using Map Time
Vector feature visibility can follow the active timeline with Expression.mapTime (["map-time"], Unix seconds). Built-in tropical tracks and convective outlooks use this automatically.
layer.filter = Expression.lessThanOrEqual(
    Expression.get("timestamp"),
    Expression.mapTime,
)
Using Advanced Expressions
When you need greater control over data-driven styles or your datasets do not contain the necessary style information, you can instead provide an expression to return the style information for an individual paint property. These expressions will evaluate the data associated for each feature and use the resulting value.
An expression has the following structure:
["<operator>", <arg1>, <arg2>, ...]Build these operators with the Kotlin factories on Expression. Wrap the result in StyleValue.Expression when assigning a paint property.
For example, you start with a basic circle style layer to render current earthquake data from our Weather API. You could configure the layer and its styling as follows:
val config = WeatherService.Earthquakes(controller.service) as WeatherLayerConfiguration<*, *>
val paint = config.layer.paint as CircleLayerPaint
paint.fill.color = StyleValue.Constant(Color("#FFFF0000".toColorInt()))
paint.stroke.color = StyleValue.Constant(Color("#FFFFFFFF".toColorInt()))
paint.stroke.thickness = StyleValue.Constant(3.0)
paint.circle.radius = StyleValue.Constant(10.0)
controller.addWeatherLayer(config)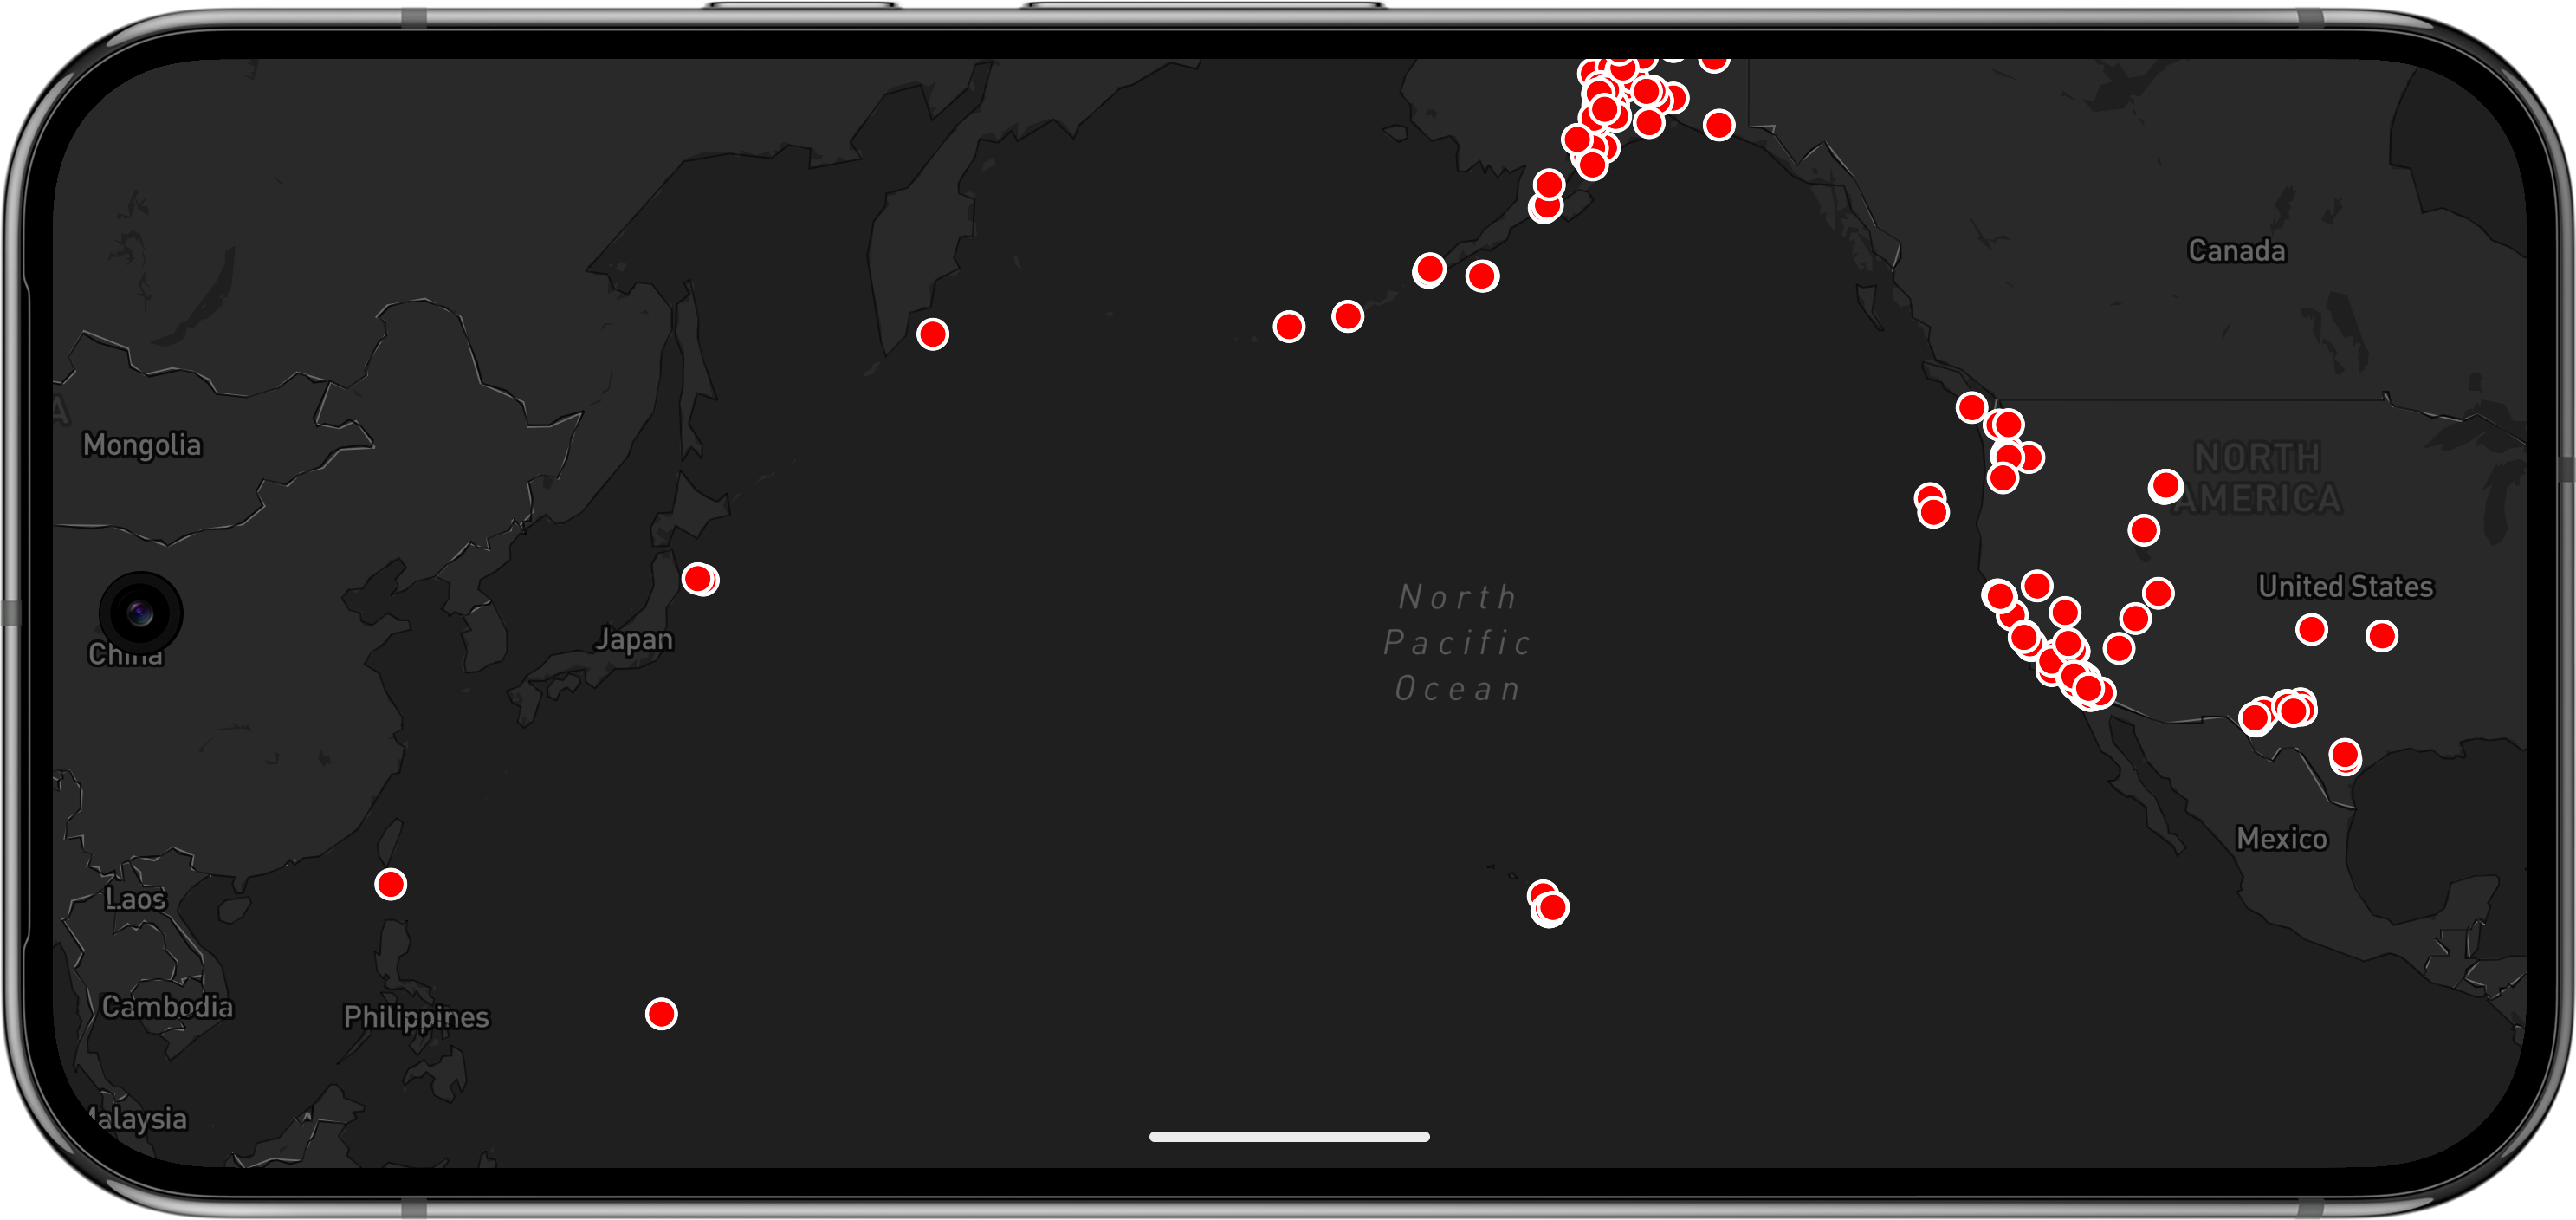
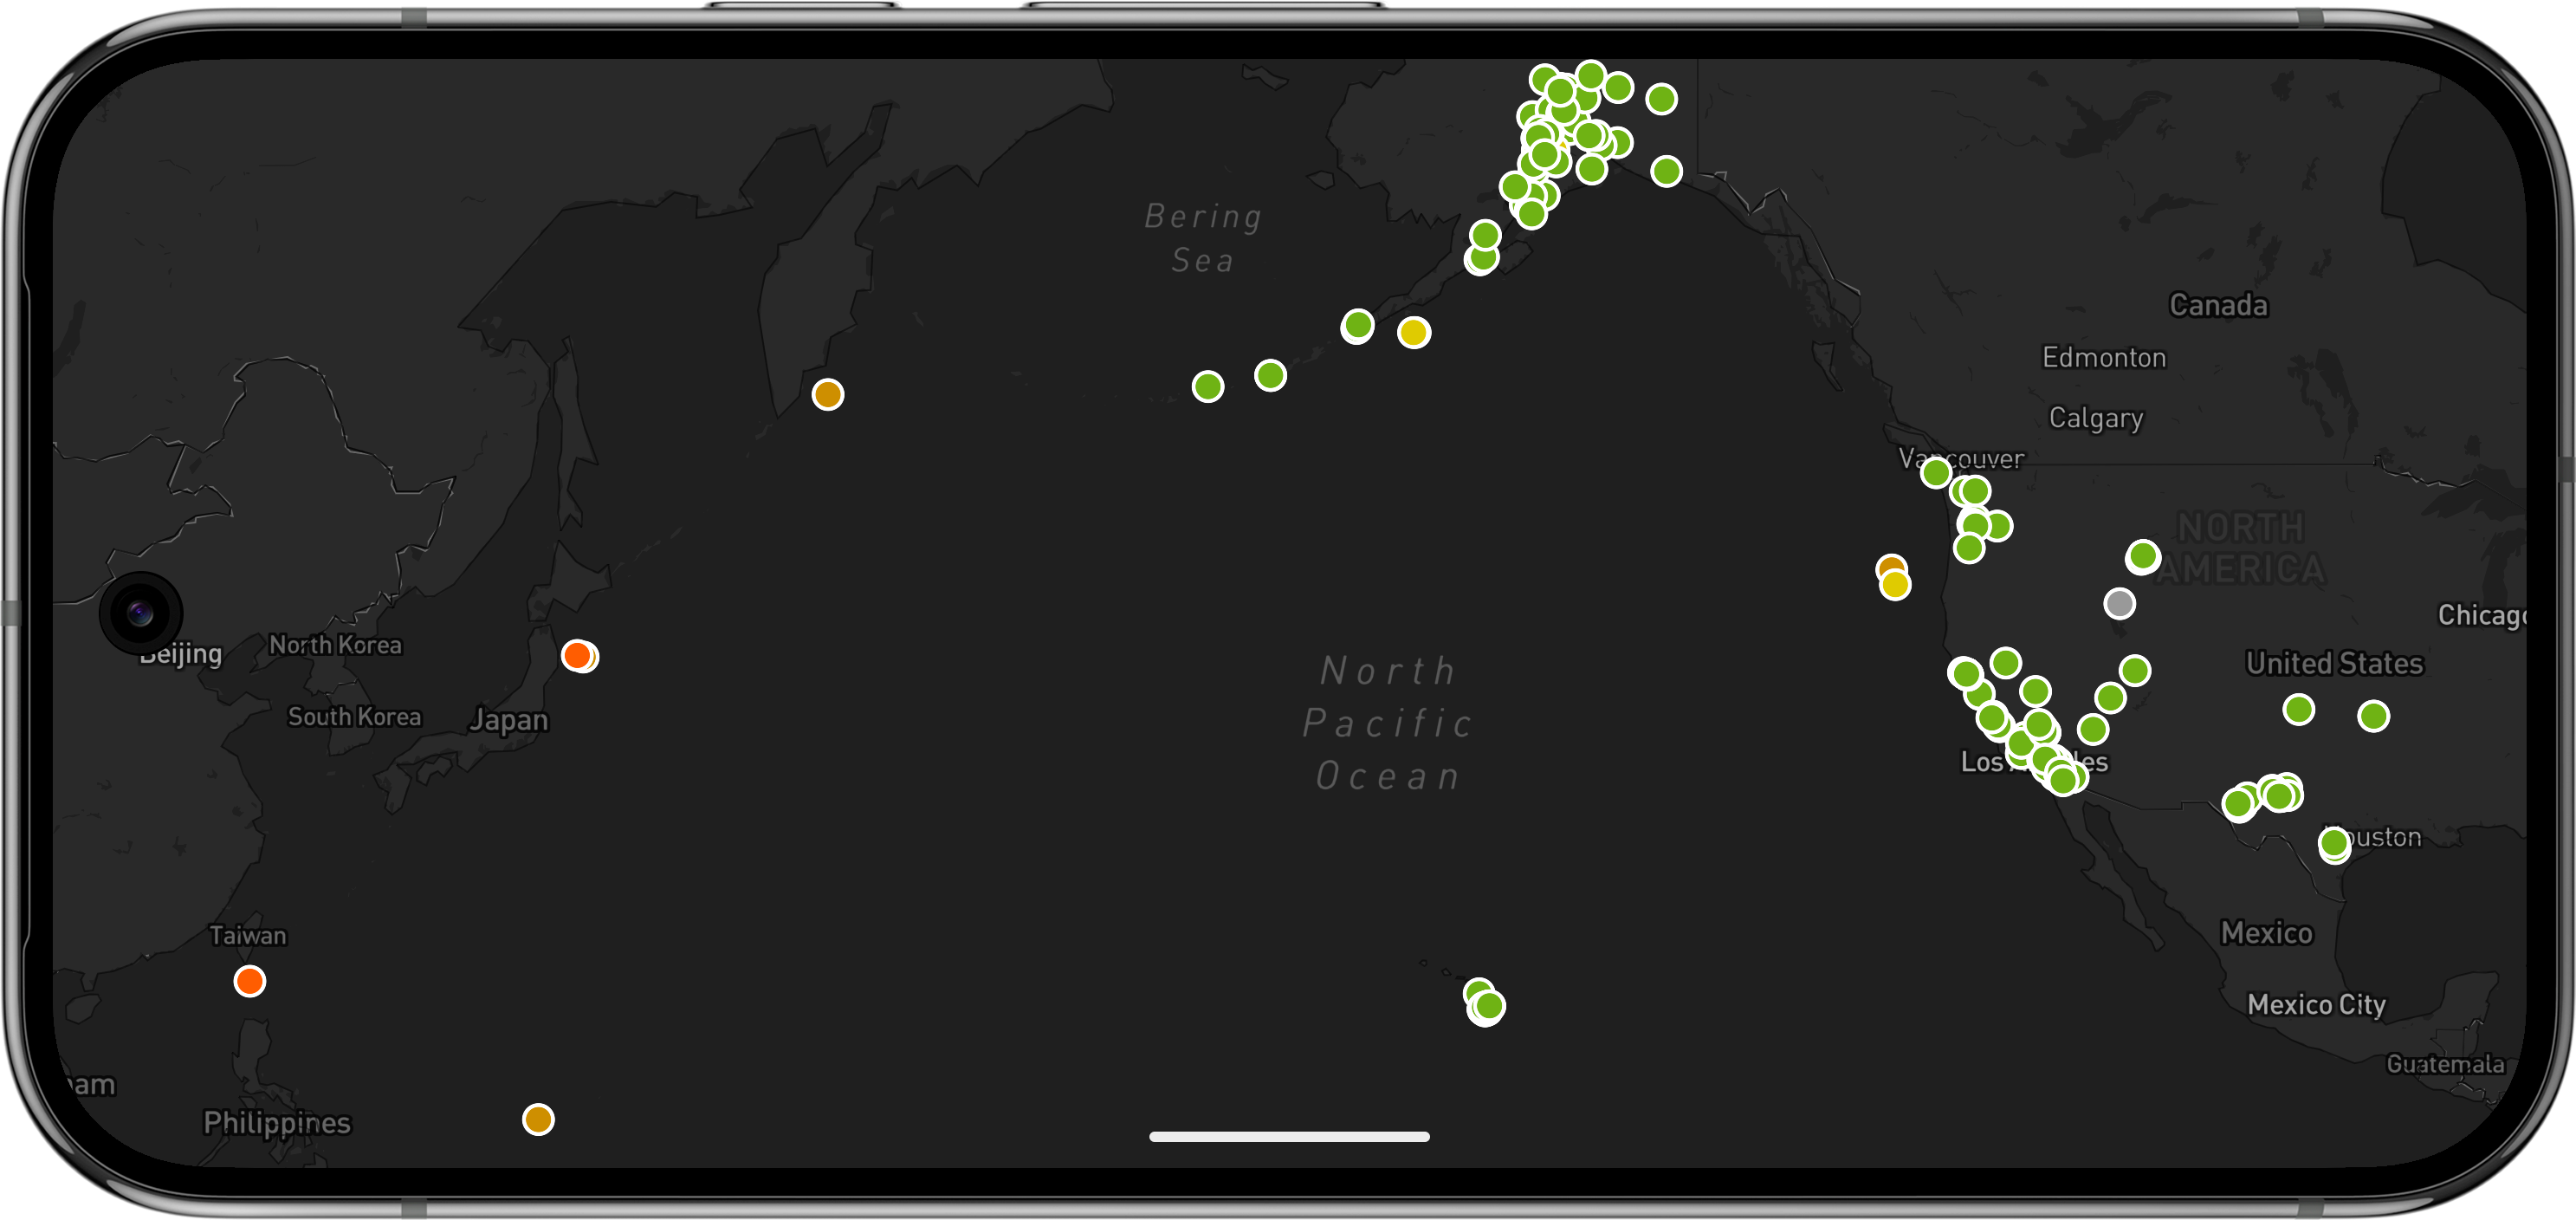
But coloring each earthquake report the same color isn’t a very useful data visualization since it tells the user nothing about the actual data, such as quake magnitude. A better approach would be to configure our fill style to derive a fill color based on the magnitude of each earthquake report as provided by our weather API’s earthquake endpoint:
val config = WeatherService.Earthquakes(controller.service) as WeatherLayerConfiguration<*, *>
val paint = config.layer.paint as CircleLayerPaint
paint.fill.color = StyleValue.Expression(
    Expression.match(
        Expression.downcase(Expression.get("report.type")),
        listOf(
            Expression.Step("mini", "#6fb314"),
            Expression.Step("minor", "#dfcb01"),
            Expression.Step("light", "#ce8f00"),
            Expression.Step("moderate", "#ff5d01"),
            Expression.Step("strong", "#e90004"),
            Expression.Step("major", "#ce0052"),
            Expression.Step("great", "#b90285"),
            Expression.Step("catastrophic", "#f500ff"),
        ),
        "#999999"
    ),
)
paint.stroke.color = StyleValue.Constant(Color("#FFFFFFFF".toColorInt()))
paint.stroke.thickness = StyleValue.Constant(3.0)
paint.circle.radius = StyleValue.Constant(10.0)
controller.addWeatherLayer(config)
The above paint style configuration will result in the following output:
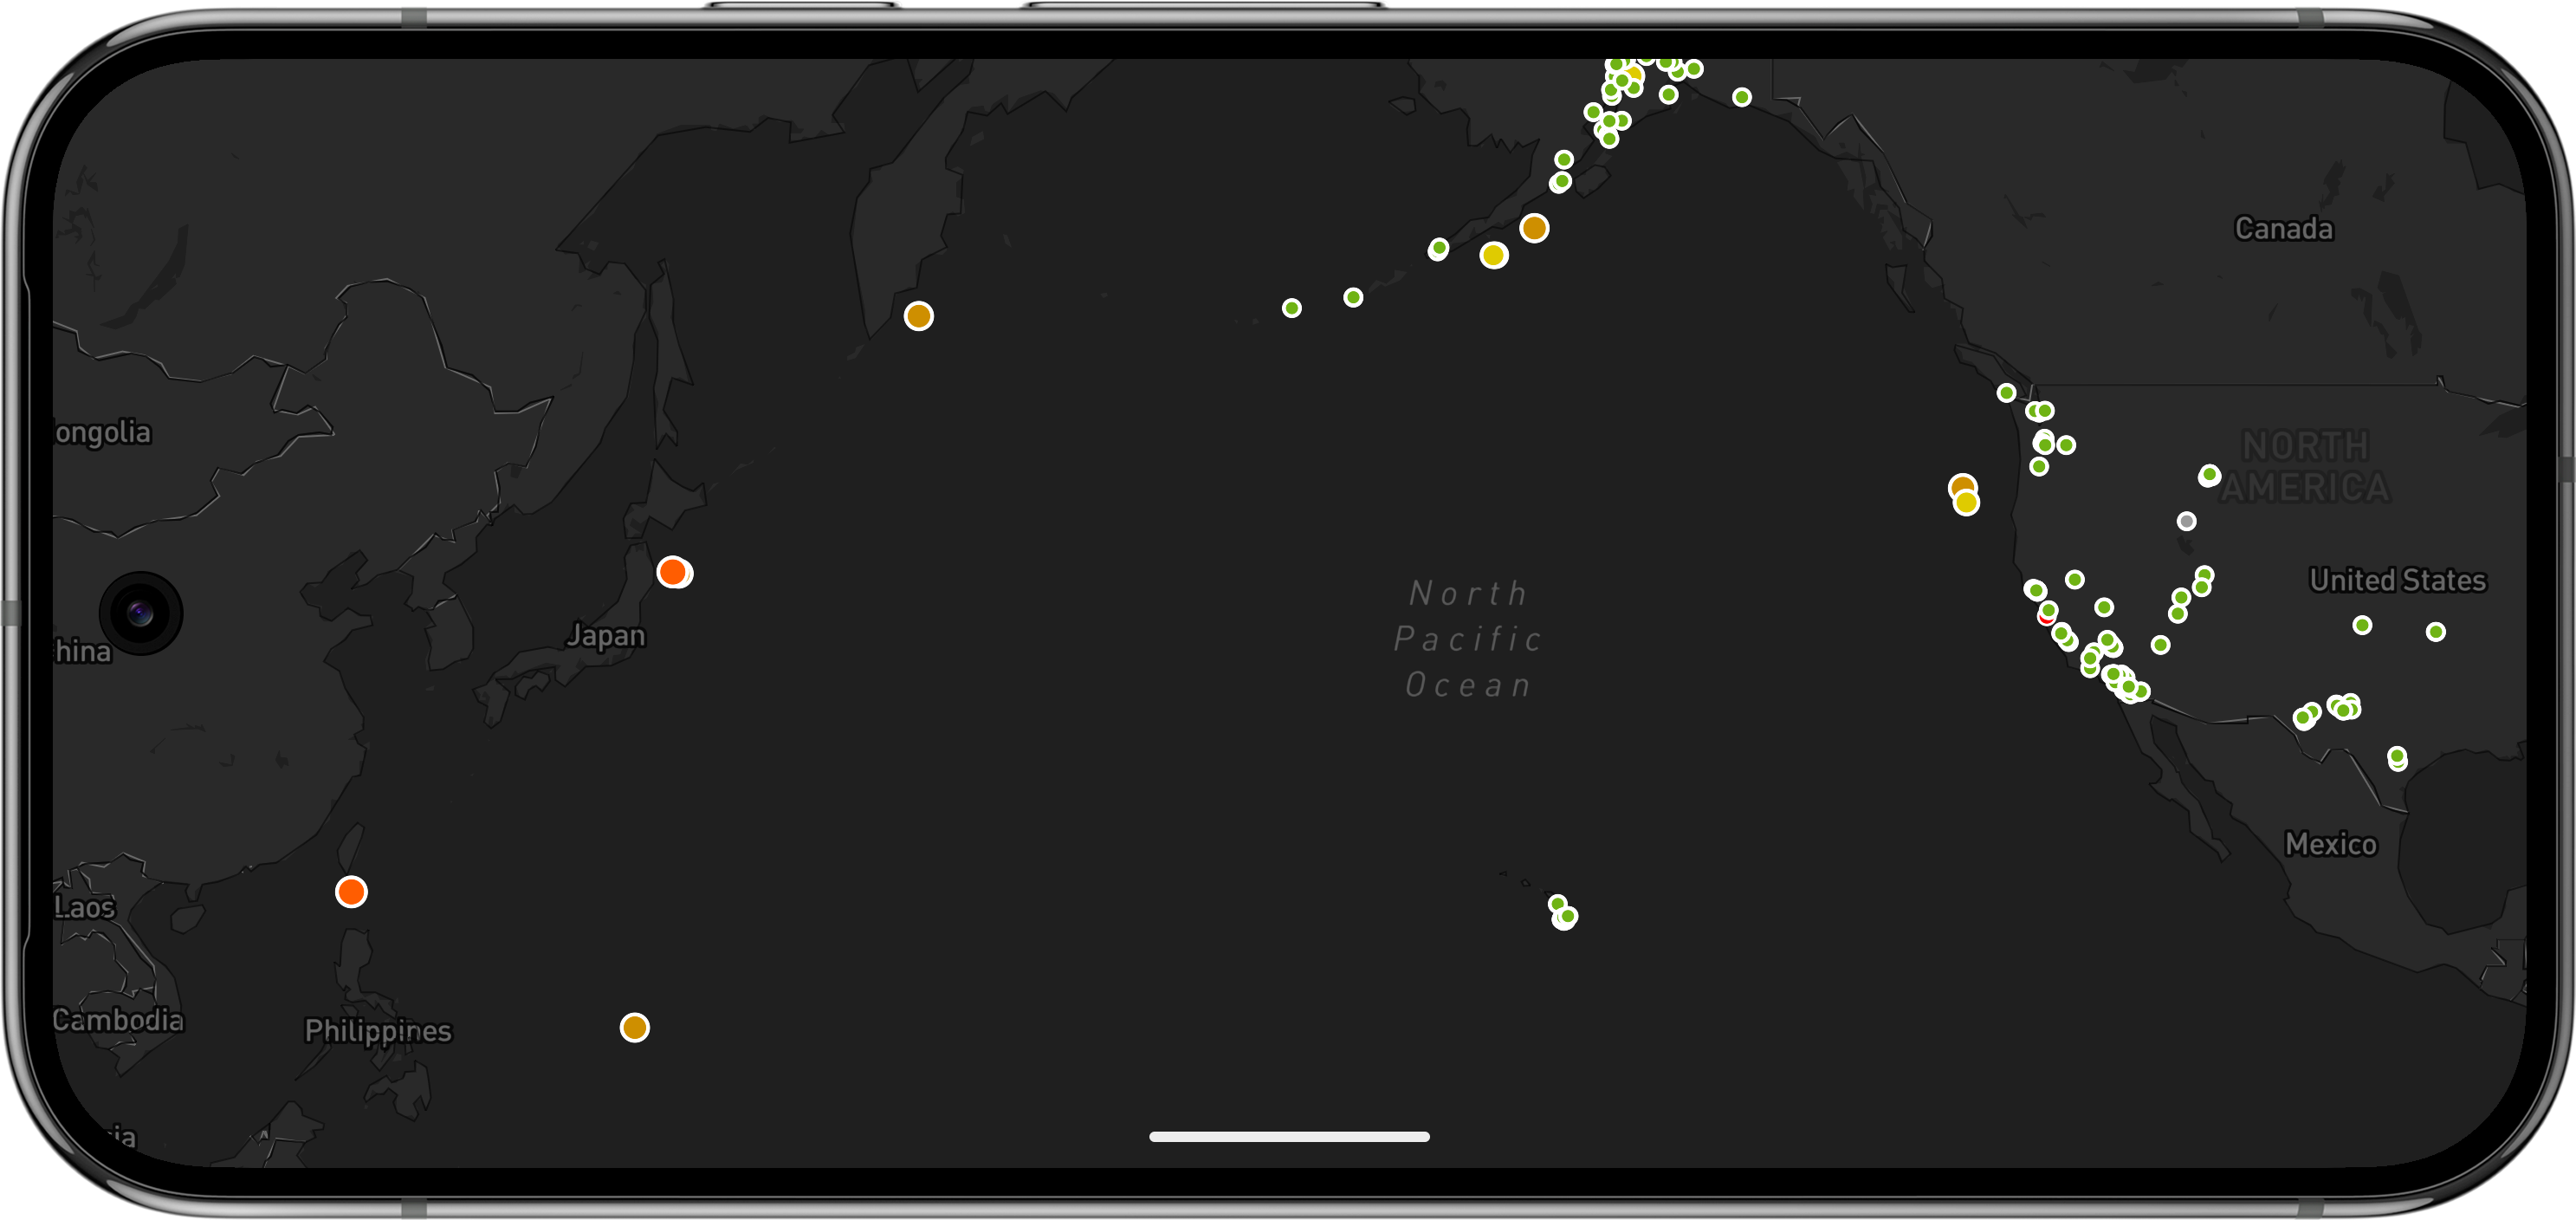
You can use expressions to derive values for multiple paint properties as well. So we can take the above example even further and update it to also control circle radius values based on the same magnitude data so that larger earthquakes have a greater visual impact:
val config = WeatherService.Earthquakes(controller.service) as WeatherLayerConfiguration<*, *>
val paint = config.layer.paint as CircleLayerPaint
paint.fill.color = StyleValue.Expression(
    Expression.match(
        Expression.downcase(Expression.get("report.type")),
        listOf(
            Expression.Step("mini", "#6fb314"),
            Expression.Step("minor", "#dfcb01"),
            Expression.Step("light", "#ce8f00"),
            Expression.Step("moderate", "#ff5d01"),
            Expression.Step("strong", "#e90004"),
            Expression.Step("major", "#ce0052"),
            Expression.Step("great", "#b90285"),
            Expression.Step("catastrophic", "#f500ff"),
        ),
        "#999999"
    ),
)
paint.stroke.color = StyleValue.Constant(Color("#FFFFFFFF".toColorInt()))
paint.stroke.thickness = StyleValue.Constant(3.0)
paint.circle.radius = StyleValue.Expression(
    Expression.match(
        Expression.downcase(Expression.get("report.type")),
        listOf(
            Expression.Step("minor", result = 8),
            Expression.Step("light", result = 9),
            Expression.Step("moderate", result = 10),
            Expression.Step("strong", result = 12),
            Expression.Step("major", result = 14),
            Expression.Step("great", result = 17),
            Expression.Step("catastrophic", result = 20),
        ),
        5,
    ),
)
controller.addWeatherLayer(config)
Controlling both the color and size based on feature data will result in the following output:
For continuous values, interpolate between stops instead of matching discrete labels. Linear, exponential, and cubic-bezier ramps all evaluate:
paint.fill.color = StyleValue.Expression(
    Expression.interpolate(
        Expression.get("report.mag"),
        listOf(2.0, "rgba(0, 0, 255, 1)", 6.0, "rgba(255, 0, 0, 1)"),
    ),
)
paint.circle.radius = StyleValue.Expression(
    Expression.interpolate(
        Expression.get("report.mag"),
        listOf(2.0, 6.0, 6.0, 18.0),
    ),
)
The operators GLES actually evaluates — including has, rgb / rgba, let / var, and string/array ops — are listed on the Expressions reference.
Refer to the list of supported style properties and their expected return types for each render style listed above when using data-driven styling.
To change paint after a layer is on the map, use MapController.setPaintProperty for sample color scales, particle settings, and symbol text. For other vector paint, update the paint object and call MapController.refreshGlVectorLayerPaint. For a live feature filter, call MapController.setLayerFilter.
Refer to our supported weather layers and weather layer styling documentation for more details and examples when working with weather layers within the MapsGL SDK