MapsGL Android - Styling Weather Data
The benefit of MapsGL over raster-based image tile offerings is that everything is rendered at runtime, meaning you have complete control over the styling of your weather layers. When adding weather layers to your map via the map controller using addWeatherLayer, you can customize the layer’s configuration, including paint styles, to override any default styling configurations.There are essentially two approaches to styling weather layers: basic and advanced.
Basic Style Overrides
Overriding basic paint style properties of weather layers are the most straightfoward and can result in a unique variety of weather visualizations. These include style properties like fill and stroke color, sample color scales, opacity, and more.
Sample Fill
Sample fill renderers are configured with a color scale and interval, where you provide ColorStop values to define the color stop positions and color values. The underlying data from the source is then colorized based on the color scale when rendering data to the map. Sample fill weather layers include most encoded raster datasets, such as temperature, wind speed, dew point, precipitation, etc. All weather layers whose type is sample uses this render style and can be customized.
For instance, you want to render temperatures with a custom color scale at a lower data quality and using a different interval, such as every 2 degrees F instead of the default of 0.1 degree F. You would just need to provide the necessary configuration overrides for the data and sample paint style options for your needs:
try {
	val layerConfiguration = run {
		val temperatureColorScale = ColorScaleOptions(
			stops = listOf(
                ColorStop(-67.78, "#e9c5f7"),
                ColorStop(-45.56, "#f90c86"),
                ColorStop(-28.89, "#d276bf"),
                ColorStop(-23.33, "#6b41a7"),
                ColorStop(-17.78, "#e4e7ff"),
                ColorStop(-12.22, "#464ab5"),
                ColorStop(-6.67, "#3375ed"),
                ColorStop(-1.11, "#03f8f6"),
                ColorStop(0.00, "#6bea99"),
                ColorStop(7.22, "#19a00f"),
                ColorStop(15.56, "#fdff87"),
                ColorStop(26.67, "#cc2001"),
                ColorStop(32.22, "#901436"),
                ColorStop(37.78, "#e36f7e"),
                ColorStop(43.33, "#ffbcff"),
                ColorStop(48.89, "#b371c6"),
                ColorStop(54.44, "#8a0f5f")
            ),
		)
		// Override defaults on temperature configuration
        val config = WeatherService.Temperatures(controller.service) as WeatherLayerConfiguration<*, *>
        val paint = config.layer.paint as SampleLayerPaint
        paint.sample.colorScale = temperatureColorScale
		config
	}
	controller.addWeatherLayer(layerConfiguration)
} catch (e: Exception) {
	println("Failed to add weather layer: ${e.message}")
}
Note that all data values for weather layers in MapsGL are defined in Metric units, which means your sample color scale configurations also need to use Metric units.
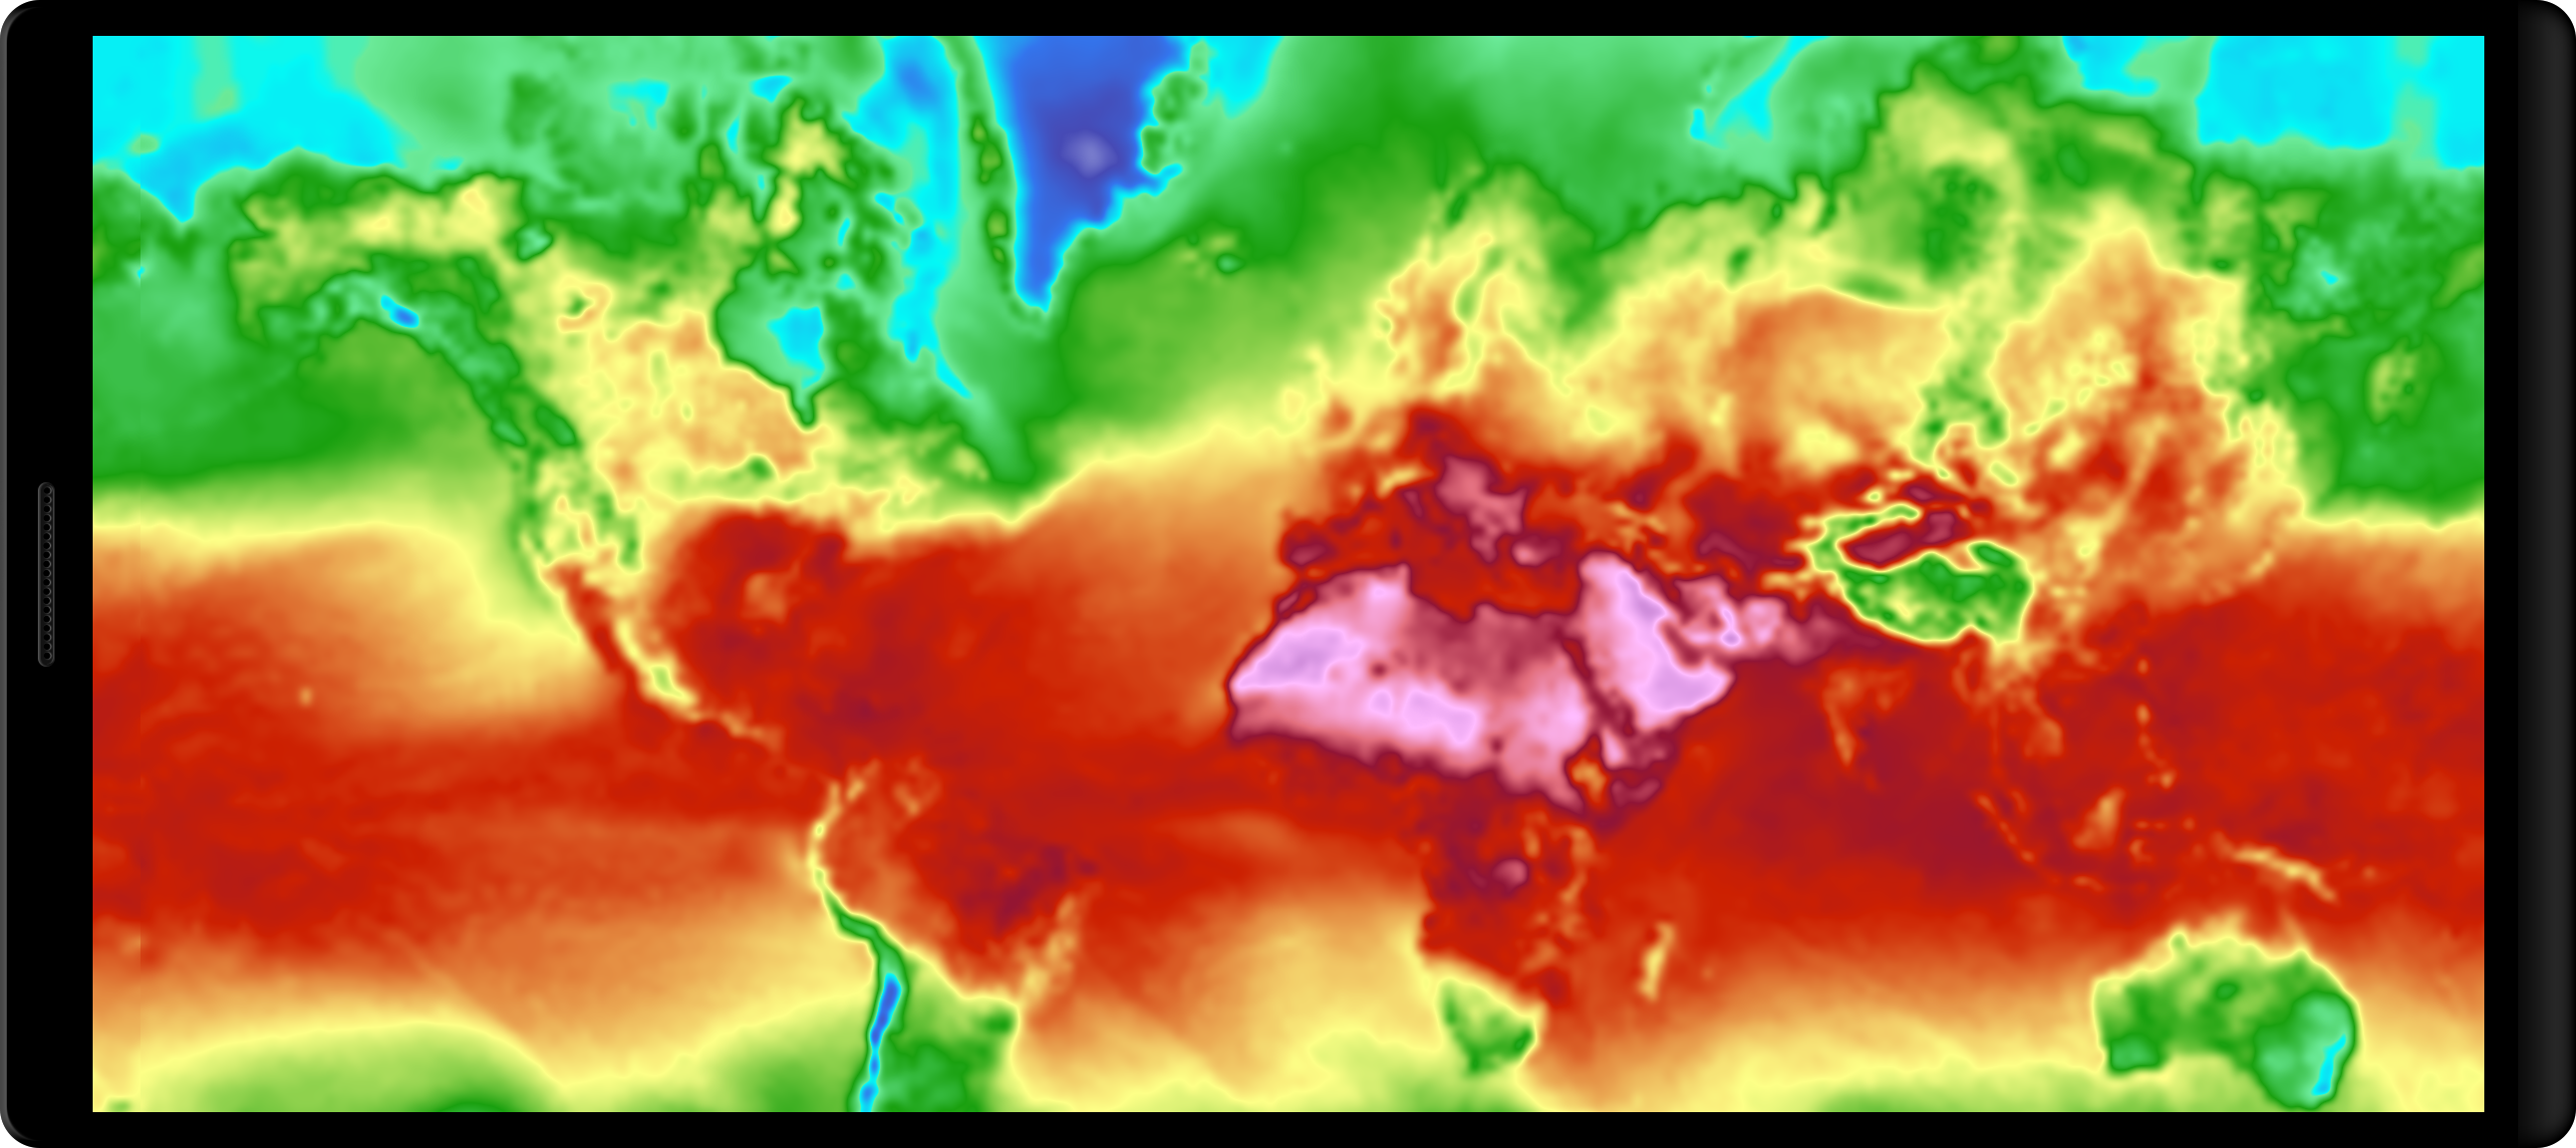
The above configuation will result in temperatures being rendered as below:
Advanced Style Overrides
While performing basic style overrides on weather layers provides an opportunity for uniquenss and differentiation with your weather data, perhaps you want to tell a completely different story than our default weather layers.
Sample Fill
try {
val layerConfiguration = run {
val colorScale = ColorScaleOptions(
stops = listOf(
ColorStop(-67.78, "#e9c5f7"),
ColorStop(-45.56, "#f90c86"),
ColorStop(-28.89, "#d276bf"),
ColorStop(-23.33, "#6b41a7"),
ColorStop(-17.78, "#e4e7ff"),
ColorStop(-12.22, "#464ab5"),
ColorStop(-6.67, "#3375ed"),
ColorStop(-1.11, "#03f8f6"),
ColorStop(0.00, "#6bea99"),
ColorStop(7.22, "#19a00f"),
ColorStop(15.56, "#fdff87"),
ColorStop(26.67, "#cc2001"),
ColorStop(32.22, "#901436"),
ColorStop(37.78, "#e36f7e"),
ColorStop(43.33, "#ffbcff"),
ColorStop(48.89, "#b371c6"),
ColorStop(54.44, "#8a0f5f")
),
)
colorScale.interpolate = false
val config = WeatherService.Temperatures(controller.service) as WeatherLayerConfiguration<*, *>
val paint = config.layer.paint as? SampleLayerPaint
paint?.sample?.colorScale = colorScale
config
}
controller.addWeatherLayer(layerConfiguration)
} catch (e: Exception) { // Catch a specific exception type if known
println("Failed to add weather layer: ${e.message}")
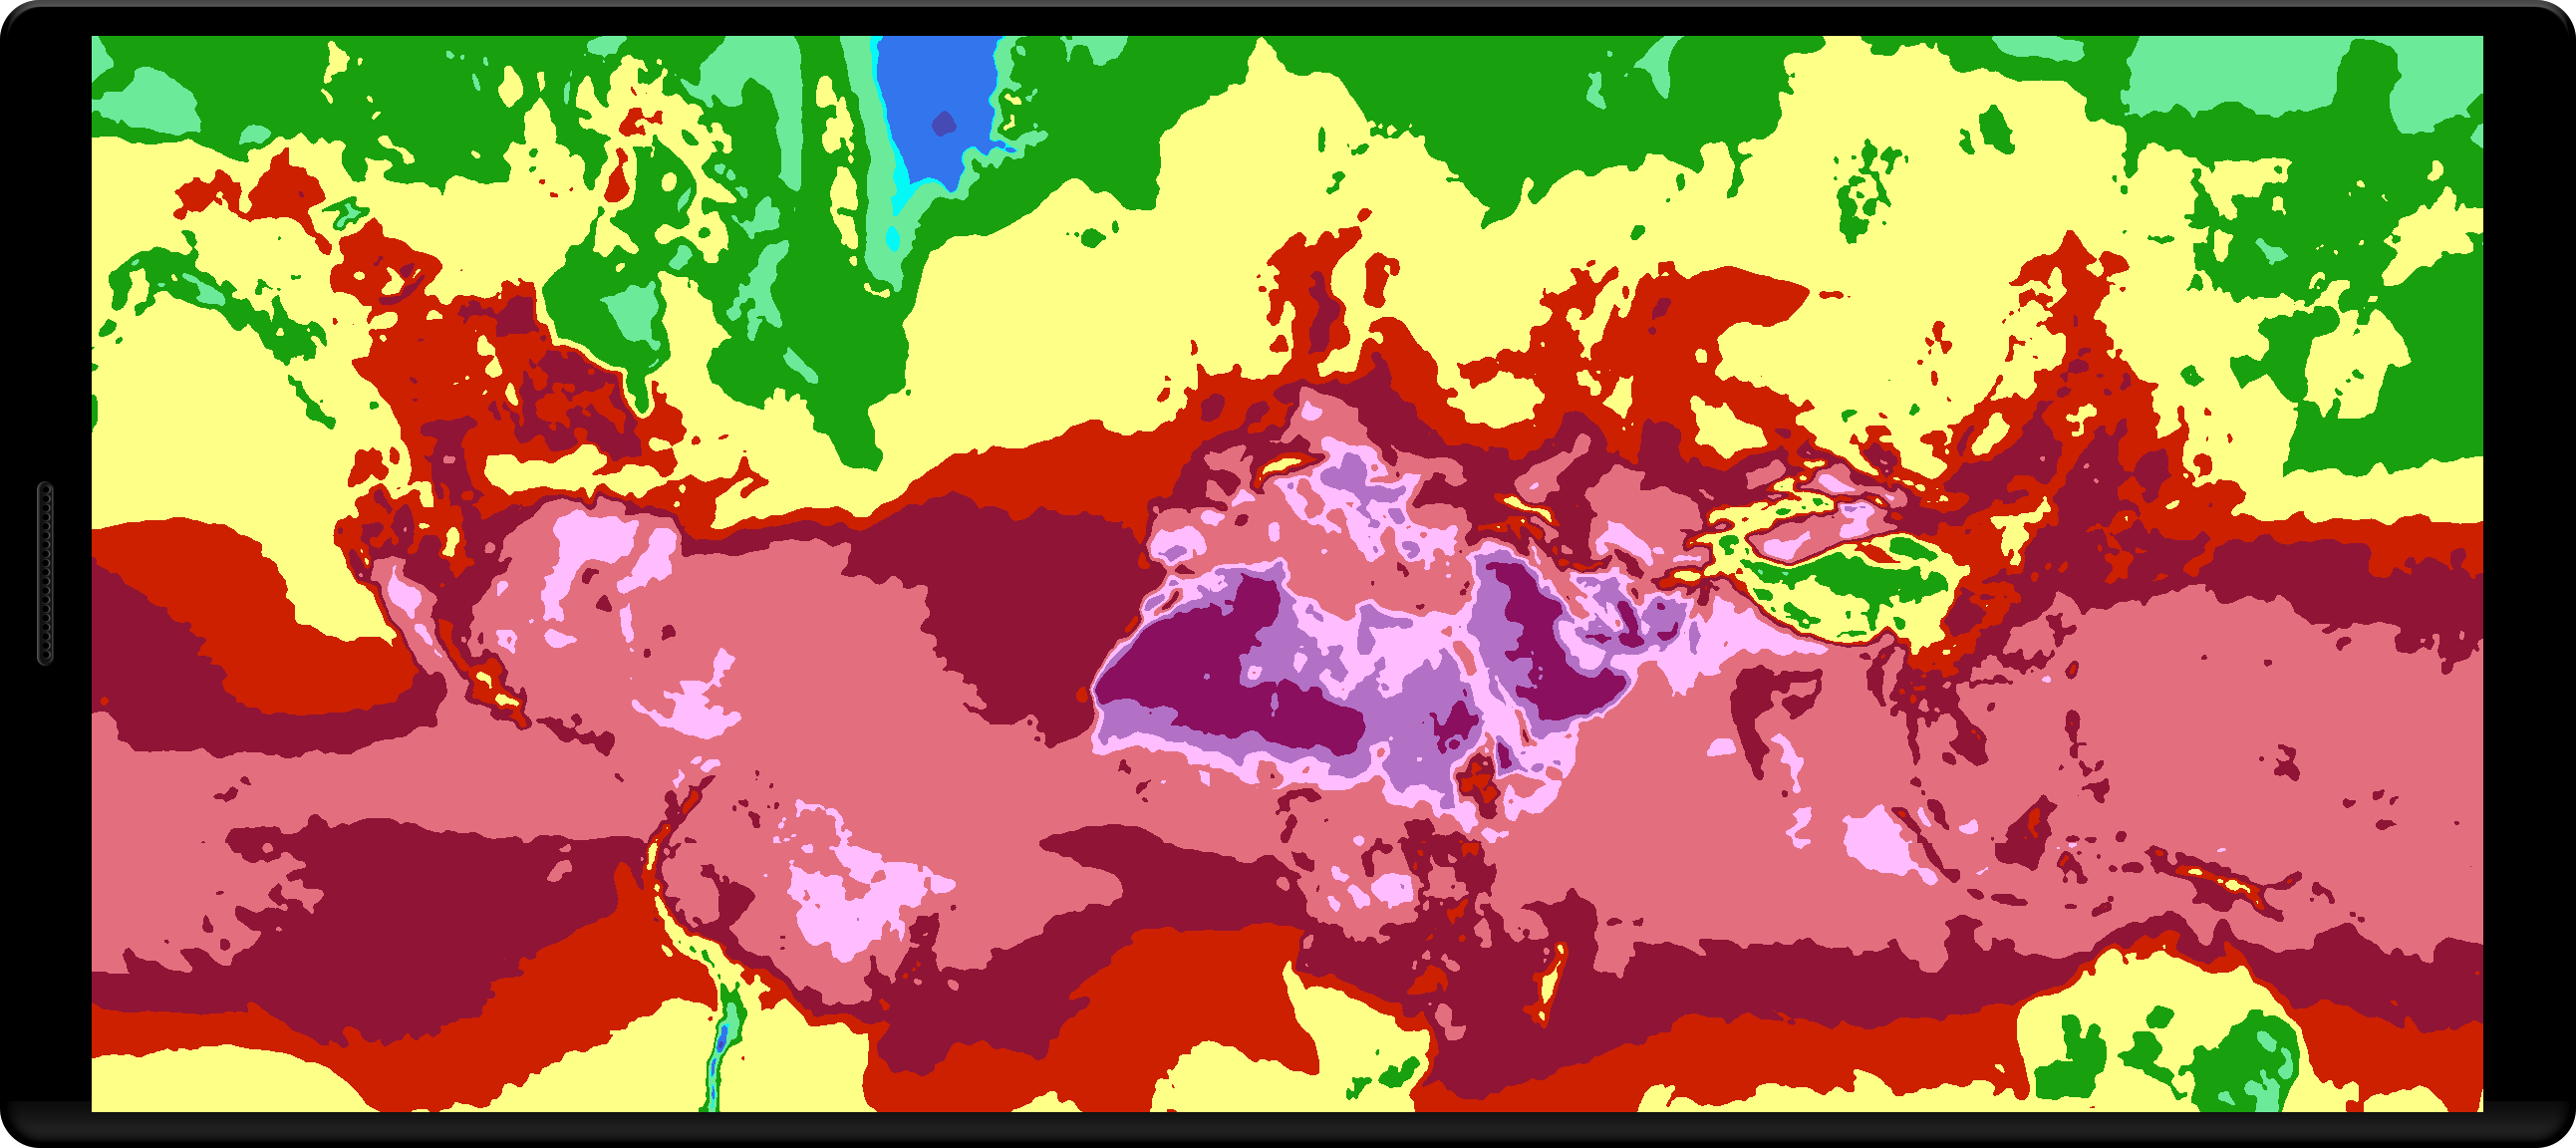
}The color scale interpolation is disabled so that color values aren’t interpolated between the defined color stops. For this, we have set interpolate to false on the ColorScaleOptions.
The above configuration will produce the following result:
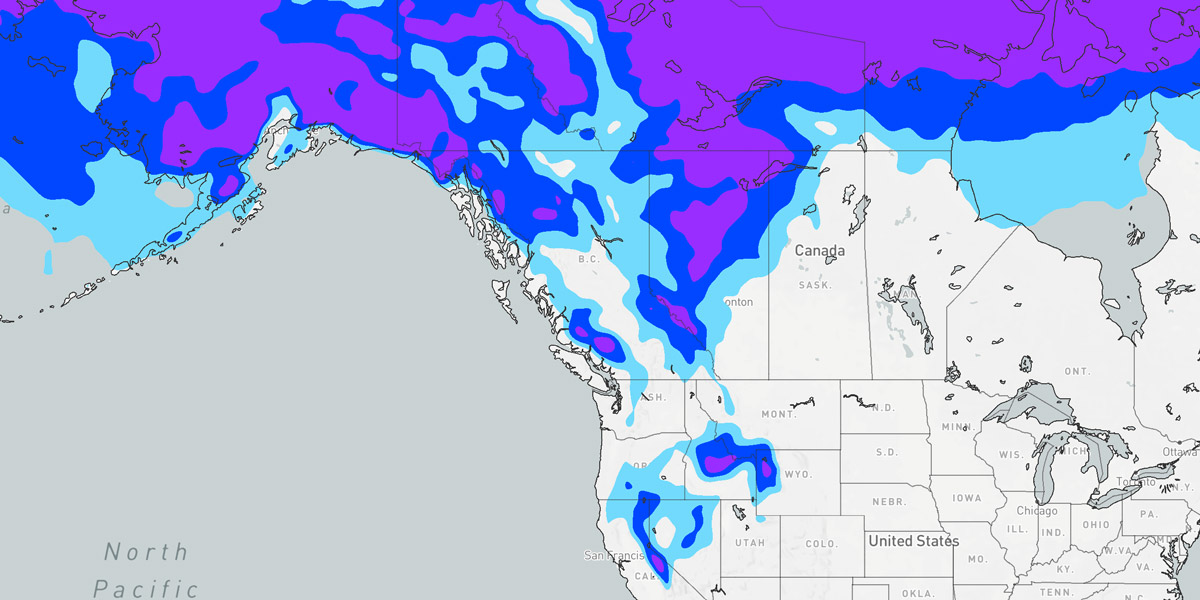
The data quality could also be reduced to give a less-detailed visualization and more of a general outlook:
map.addWeatherLayer('temperatures', {
    data: {
        quality: aerisweather.mapsgl.DataQuality.minimal
    },
    paint: {
        sample: {
            drawRange: { max: FtoC(36) },
            colorscale: {
                stops: [
                    FtoC(-80), '#992BFF',
                    FtoC(28), '#0046FF',
                    FtoC(32), '#73DAFC',
                    FtoC(36), '#73DAFC'
                ],
                interpolate: false
            }
        }
    }
});