MapsGL Android - Create a wind speed categories layer
This is the frost map’s recipe applied to wind. The ordinary wind-speeds weather layer gets a stepped colour scale of five named categories and a one-sided drawRange that leaves everything calmer than 15 mph undrawn.
It is the Android port of the MapsGL JS Create a wind speed categories layer example. The complete activity ships in the MapsGL Android SDK demo as WindSpeedCategoriesActivity.
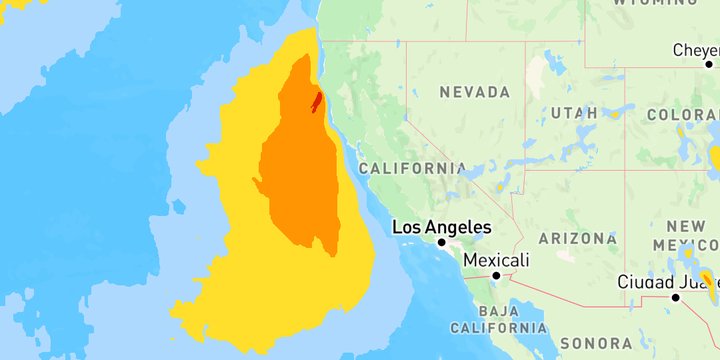
Five categories, in mph
| Category | Range | Colour |
|---|---|---|
| Breezy | 15 to under 25 mph | #AED9FE |
| Windy | 25 to under 39 mph | #FFDF2C |
| Gale / Tropical Storm Force | 39 to under 55 mph | #FF9503 |
| Storm / Severe Gale | 55 to under 75 mph | #DB2500 |
| Hurricane Force | 75 mph and up | #D802E0 |
The activity keeps each category’s threshold, colour and label together, so the colour scale and the legend are both built from one list:
val CATEGORIES = listOf(
    Category(15.0, "#AED9FE", "Breezy"),
    Category(25.0, "#FFDF2C", "Windy"),
    // …
    Category(75.0, "#D802E0", "Hurricane Force"),
)
Stops in m/s, not mph
Wind data arrives in metres per second, and a colour stop or a draw range is always in the data’s own units, never the map’s display units. The thresholds are written in mph and converted as the stops are built, with mphToMs from com.xweather.mapsgl.utils — the same helper, and the same factor, as the MapsGL JS example’s units.mphToMs:
sample.colorScale = ColorScaleOptions(
    stops = CATEGORIES.map { ColorStop(mphToMs(it.mph), it.color) },
    range = 0.0..mphToMs(120.0),
    interpolate = false,
)
interpolate = false is what makes the categories flat bands instead of a fade from one colour into the next. range is the span the stops are placed against; left off, it falls back to the stops’ own span, which would stretch the top category over the rest of the scale.
A drawRange open at the top
sample.drawRange = BoundedRange.atLeast(mphToMs(CATEGORIES.first().mph))Most of the map is calmer than 15 mph, and without the draw range it would all be painted in the Breezy colour. BoundedRange.atLeast sets the floor and leaves the top open — the equivalent of the JS example’s drawRange: { min: … }.
A legend that names the categories
The JS example shows no legend. Here the bands are named categories rather than a continuous field, so the activity replaces the layer’s built-in bar with a point legend — one labelled swatch per category, taken from the same list:
config.legend = PointLegend(
    id = "wind-speed-categories",
    title = "Wind Speed",
    items = CATEGORIES.map {
        PointLegendItem(android.graphics.Color.parseColor(it.color), it.label)
    },
)
Related
- Create a freeze layer — the same stepped scale, one-sided draw range and point legend, on the temperatures layer
- Adjusting particle draw range in real time — a two-sided draw range on wind particles, changed from sliders