MapsGL Android - Create a freeze layer
Nothing in this example is a dedicated product. It is the ordinary temperatures weather layer with a three-colour stepped scale and everything above freezing-ish clipped away — which is how an agricultural frost map is usually made.
It is the Android port of the MapsGL JS Create a freeze layer example. The complete activity ships in the MapsGL Android SDK demo as FrostFreezeLayerActivity.
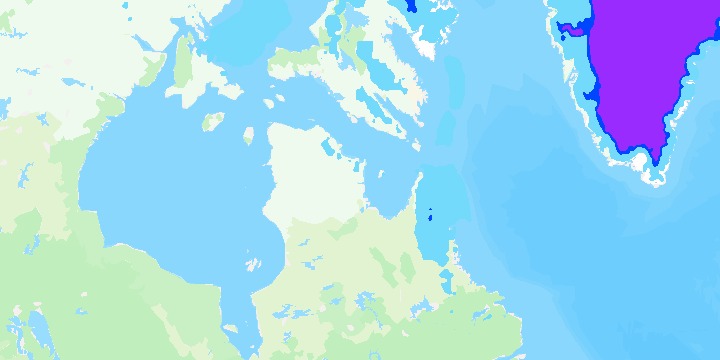
Three bands, and nothing above them
| Band | Range | Colour |
|---|---|---|
| Hard freeze | at or below 28 °F (−2.22 °C) | #992BFF |
| Freeze | above 28 °F, at or below 32 °F (0 °C) | #0046FF |
| Frost | above 32 °F, at or below 36 °F (2.22 °C) | #73DAFC |
interpolate = false is what turns the ramp into bands. Left on, the scale fades one colour into the next and there is no line at 32 °F to look at:
paint.sample.colorScale = paint.sample.colorScale.copy(
    stops = FROST_FREEZE_STOPS,
    interval = 1.0,
    interpolate = false,
)
copy() rather than a fresh ColorScaleOptions, so the built-in scale’s other fields survive — only the stops, the interval and the interpolation are being replaced.
drawRange is what makes it a frost map rather than a temperature map
paint.sample.drawRange = BoundedRange.atMost(FROST_MAX_C)Everything warmer than 36 °F is simply not drawn. Without it the layer still covers the map in its coldest colour wherever it has data, and the point of the map — where frost is possible tonight — is lost in it.
BoundedRange.atMost is the direct equivalent of the JS example’s drawRange: { max: 2.22 }: the bottom is left open, and the renderer fills it in from the layer’s own data range. A plain ClosedRange works as well — drawRange = -90.0..2.22 — but only by naming a floor this map has no opinion about.
The legend is a point legend, not a bar
Three named categories are not a continuous ramp, so the legend is three labelled swatches rather than the bar the temperatures layer normally carries:
config.legend = PointLegend(
    id = "temps-freeze",
    title = "Frost/Freeze",
    items = listOf(
        PointLegendItem(Color.parseColor("#992BFF"), "Hard Freeze"),
        PointLegendItem(Color.parseColor("#0046FF"), "Freeze"),
        PointLegendItem(Color.parseColor("#73DAFC"), "Frost"),
    ),
)
Assigning WeatherLayerConfiguration.legend before the layer is added is what replaces the built-in one.
The inspector names the band, not just the temperature
Presentation is the counterpart of the JS example’s data.evaluator: a title, and a function turning the sampled value into the row the data inspector shows.
config.presentation = Presentation(
    title = "Frost/Freeze",
    fn = { features ->
        val celsius = ((features as? Map<*, *>)?.get("value") as? Number)?.toDouble()
        // … pick the band, then format it
    },
)
Assigning it to WeatherLayerConfiguration.presentation replaces the built-in temperature readout, so a tap on the ice sheet reads Hard Freeze: -18.30°C, -0.94°F rather than a bare temperature.
Returning an empty string suppresses the row, which is how a tap on water the map does not draw says nothing at all instead of naming a category it does not belong to. The JS function returns '' for the same case.
Related
- Customizing temperature colors — the same layer and the same banding mechanism, used to restyle the whole temperature range rather than to isolate part of it