MapsGL Android - Adding a day/night overlay
This example lays twilight and night over a weather layer and moves the terminator with the timeline. On Android there is no ready-made overlay call, so the shading is an ordinary GeoJSON source and fill layer, recomputed from the sun’s position as map time changes.
It is the Android port of the MapsGL JS Adding a day/night overlay example. The complete activity ships in the MapsGL Android SDK demo as DayNightOverlayActivity, with the geometry in DayNightGeometry.
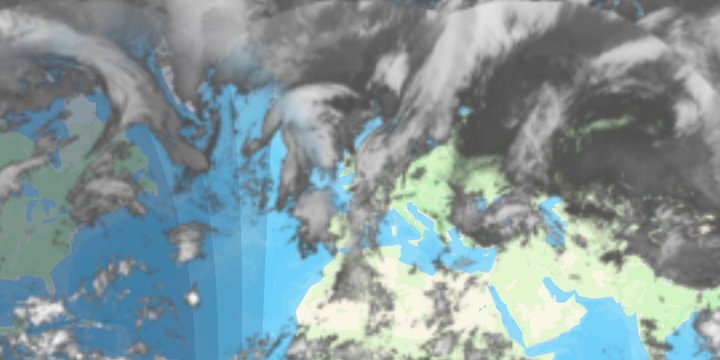
Built from a GeoJSON source and a fill layer
MapsGL JS does this with addDayNightOverlay(). The Android SDK has no counterpart, so the example assembles the same picture from parts it does have — a GeoJSONSourceDescriptor whose data is the night side, and a FillLayerDescriptor drawing it:
val source = GeoJSONSourceDescriptor(id = "day-night")
source.data = DayNightGeometry.nightBands(controller.timeline.currentDate)
controller.addSource(source)

// No beforeID: the overlay goes on top of the weather layer.
controller.addLayer(fillDescriptor(), beforeID = null)
DayNightGeometry.nightBands computes the subsolar point for the given instant and returns a FeatureCollection of spherical caps around the point opposite it — every place where the sun is below a given altitude. It cuts the caps at Web Mercator’s latitude limit and splits them at the antimeridian, so the fill layer only ever receives rings it can triangulate.
Twilight is four stacked bands
Rather than a gradient, the night side is four nested caps — sunset, then civil, nautical and astronomical twilight, at sun altitudes of −0.833°, −6°, −12° and −18°. All four share one translucent colour, so deep night, covered by every band, comes out darkest.
The per-band alpha is worked back from the opacity the slider asks for, so that four layers of it add up to that value:
val perBand = 1.0 - (1.0 - opacity).pow(1.0 / DayNightGeometry.BAND_ALTITUDES.size)

FillLayerPaint(
    fill = FillPaint(
        color = StyleValue.Constant(NIGHT_COLOR),
        opacity = StyleValue.Constant(perBand),
    ),
    stroke = StrokePaint(thickness = StyleValue.Constant(0.0)),
)
The default opacity is 0.85, as in the JS example. A new opacity removes and re-adds the fill layer, since fill opacity is not a path setPaintProperty writes — the JS slider likewise calls addDayNightOverlay again.
Following the timeline
The JS overlay tracks the timeline on its own. Here the activity listens for timeline events and assigns fresh bands to the live GeoJSONSource:
controller.timeline.on(AnimationEvent.advance, advanceListener)
controller.timeline.on(AnimationEvent.stop, changeListener)
controller.timeline.on(AnimationEvent.TIMELINE_CHANGE, changeListener)
controller.timeline.on(AnimationEvent.range_change, changeListener)

val source = controller.getSource("day-night") as? GeoJSONSource ?: return
source.data = DayNightGeometry.nightBands(date)
Each assignment rebuilds the layer’s mesh, so during playback the bands are only recomputed once map time has moved ten minutes. The terminator travels about a quarter of a degree a minute, which is well under a pixel at the zooms this map uses. Stopping, or changing the timeline or its range, always redraws. The listeners are removed again in onDestroy.
Satellite or temperatures underneath
The JS example shows satellite only. A drop-down here also offers temperatures, to show the overlay shading any weather layer. The replacement layer is added with beforeId set to the overlay’s fill layer, so it lands underneath instead of on top:
val beforeId = if (overlayEnabled) FILL_LAYER_ID else null
baseLayerId = controller.addWeatherLayer(BASE_LAYERS[baseLayerIndex].second, beforeId = beforeId)?.id
The camera centre matches the JS example, but the zoom is 0 rather than 1.5, so that a portrait phone shows the whole world.
Related
- Adding custom GeoJSON data — the GeoJSON source and layer this overlay is built from
- Change timeline range — the timeline whose events drive the overlay