MapsGL Android - Temperature text labels using GeoJSON places
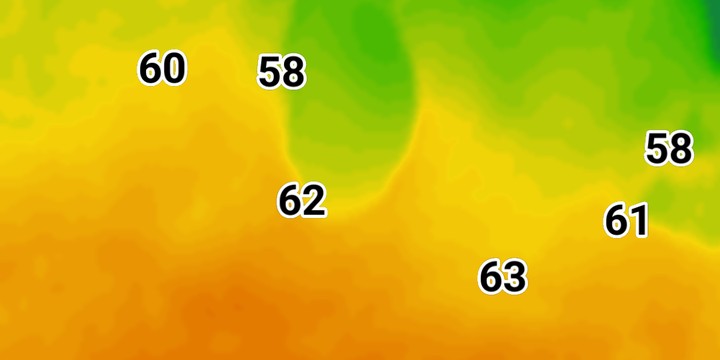
You do not draw the points in this example yourself. They are the 100 most populous US cities, fetched from the Xweather places endpoint as GeoJSON. A query layer reads the temperatures layer at each one and prints the value as a text label.
It is the Android port of the MapsGL JS Temperature text labels using GeoJSON places example. The complete activity ships in the MapsGL Android SDK demo as QueryLayerApiGeoJsonActivity.
The request is a URL, not a builder
The JS example builds the places request with account.api() and passes its URL to the source. Android has no request builder, so the source’s url spells out the same request:
controller.addWeatherLayer(LayerCode.TEMPERATURES)

controller.addSource(
    GeoJSONSourceDescriptor(
        id = "cities",
        url = "https://data.api.xweather.com/places/search" +
            "?query=country:us,name:!NULL&sort=pop:-1&limit=100&format=geojson" +
            "&client_id={clientId}&client_secret={clientSecret}",
    ),
)
{clientId} and {clientSecret} are placeholders. The descriptor sets no authenticator, so addSource attaches the controller’s own. That authenticator fills the placeholders in from the account when the source loads, and the credentials never appear in the URL you write.
The query layer samples another layer at each point
DataQueryLayerDescriptor is the Android version of the JS type: 'query' layer. sampledLayerCode does the job of queryLayer: it names the layer whose data is read at every point in the source.
controller.addLayer(
    DataQueryLayerDescriptor(
        id = "cities-text",
        source = "cities",
        sampledLayerCode = LayerCode.TEMPERATURES,
        labelKeyPath = "place.name",
        paint = SymbolLayerPaint(
            icon = IconPaint(),
            text = text,
            pitchWithMap = false,
            rotateWithMap = false,
        ),
    ),
    beforeID = null,
)
The label itself is a TextPaint whose value is Expression.variable("dataValue"), the sampled number. It is size 24, bold, black with a white outline. allowOverlap is on, so every city keeps its label.
The value is already in the map’s units
The JS example converts the sample from Celsius to Fahrenheit with a to-unit expression. The Android label uses the plain dataValue, because the SDK has already converted it into the map’s temperature unit, which defaults to Fahrenheit. If you change the map’s units, the labels follow without any edit to the layer.
The JS example also turns off fadeOpacity. Android’s symbol paint has no such setting, so the labels fade in as symbols normally do.
Switches the JS example does not have
- Show names adds a second, smaller text block with
Expression.get("place.name"). The block is anchored withAnchor.TOPand offset below the value. It starts off, which matches the JS example’s values-only map. Text blocks belong to the layer’s paint, so the switch removes and re-adds the query layer. - Label size scales both text blocks and the gap between them, from half to twice the JS size. The layer is rebuilt when the slider is released.
- Show units sets
MapboxMapController.showTextLabelUnits, so72reads72°F. It is off by default, as in JS. The labels reformat in place and are not sampled again.
Related
- Wind speed text labels using custom GeoJSON: the same query layer over points you supply inline
- Adding custom GeoJSON data: the ways to give a GeoJSON source its features