MapsGL Android - Add a Nextzen cities text layer
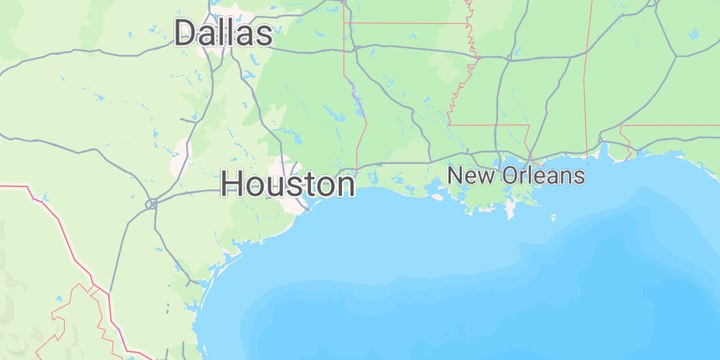
This example adds city names to the map from the Nextzen vector tile service , keeping only features whose kind property is locality. Labels for bigger cities are drawn larger.
It is the Android port of the MapsGL JS Add a Nextzen cities text layer example. The complete activity ships in the MapsGL Android SDK demo as NextzenCitiesActivity.
A Nextzen key of your own
Nextzen needs its own API key. Request one at developers.nextzen.org and set it in the activity:
const val NEXTZEN_API_KEY = "YOUR_NEXTZEN_API_KEY"The vector tile source
VectorSourceDescriptor is the JS type: 'vector' source. The tile URL takes the same {z}, {x}, and {y} templates:
controller.addSource(
    VectorSourceDescriptor(
        id = "nextzen",
        url = "https://tile.nextzen.org/tilezen/vector/v1/256/all/{z}/{x}/{y}.mvt?api_key=$NEXTZEN_API_KEY",
        tileSize = TileSize(256, 256),
        attribution = "© Nextzen, OpenStreetMap contributors",
    ),
)
A text-only symbol layer
The JS example adds a type: 'text' layer. On Android, that is a SymbolLayerDescriptor with one TextPaint and no icon. sourceLayer picks the tiles’ places layer, and the filter keeps only localities:
controller.addLayer(
    SymbolLayerDescriptor(
        id = "nextzen-cities",
        source = "nextzen",
        sourceLayer = "places",
        filter = Expression.equals(Expression.get("kind"), "locality"),
        paint = SymbolLayerPaint(
            icon = IconPaint(),
            text = listOf(
                TextPaint(
                    value = StyleValue.Expression(
                        Expression.coalesce(listOf(Expression.get("name:en"), Expression.get("name"))),
                    ),
                    size = StyleValue.Expression(citySize()),
                    weight = StyleValue.Constant("normal"),
                    color = StyleValue.Constant(Color(0xFF555555)),
                    outlineColor = StyleValue.Constant(Color.White),
                ),
            ),
            pitchWithMap = false,
            rotateWithMap = false,
        ),
    ),
    null,
)
Expression.coalesce uses the English name where the tile has one, and the local name otherwise.
Sized by population
Below zoom 4, every label is 12 px. From zoom 4, the size goes from 12 px to 20 px with the city’s population, capped at 5 million:
private fun citySize(): Expression = Expression.switchCase(
    listOf(Expression.Case(Expression.lessThan(Expression.zoom, 4), 12.0)),
    Expression.interpolate(
        Expression.min(5_000_000, Expression.max(0, Expression.get("population"))),
        listOf(0, 12.0, 5_000_000, 20.0),
    ),
)
The JS example’s paint also has country and region branches for size, weight, transform, letterSpacing, and color. The filter keeps only localities, so the Android port keeps only the locality branch.
Hiding the basemap’s labels
The JS example hides Mapbox’s own symbol layers so its labels don’t overlap the basemap’s. The demo’s Mapbox Standard style keeps its place names in the basemap import, which has a switch for them:
controller.mapboxMap?.style?.setStyleImportConfigProperty(
    "basemap",
    "showPlaceLabels",
    Value.valueOf(false),
)
Related
- Adding a custom vector tile layer — another vector tile source, drawn as lines
- Filtering data — more about vector layer filters