JavaScript SDK - Display a Basic InteractiveMap
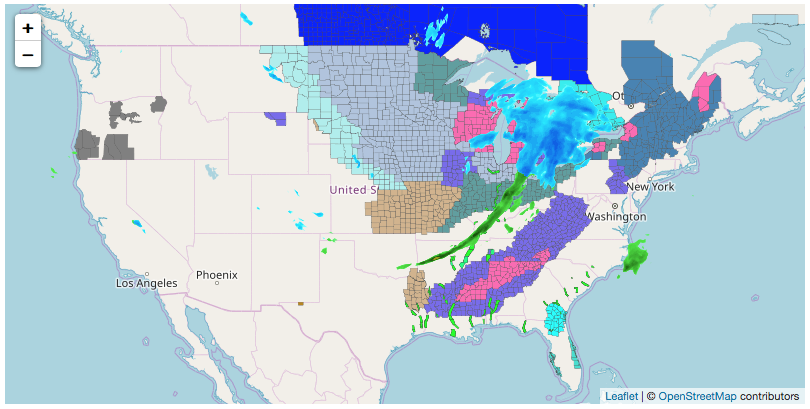
Render a basic interactive map. The following example will display an interactive map centered on the United States with alerts and radar weather layers. The animation timeline range is also set to start six hours in the past and end at the current time.
<!DOCTYPE html>
<html>
<head>
    <meta charset="UTF-8">
    <title>Xweather JavaScript SDK - Basic Interactive Map</title>
    <script defer src="https://cdn.aerisapi.com/sdk/js/latest/aerisweather.min.js"></script>
    <link rel="stylesheet" href="https://cdn.aerisapi.com/sdk/js/latest/aerisweather.css">

    <style>
    #map {
        height: 400px;
        margin: 30px auto;
        width: 800px;
    }
    </style>

</head>
<body>

<div id="map"></div>

<script>

    window.onload = () => {

        const aeris = new AerisWeather('CLIENT_ID', 'CLIENT_SECRET');

        aeris.views().then(views => {
            const map = new views.InteractiveMap(document.getElementById('map'), {
                center: {
                    lat: 39.0,
                    lon: -95.5
                },
                zoom: 4,
                layers: 'alerts,radar',
                timeline: {
                    from: -6 * 3600,
                    to: 0
                }
            });
        });
    };

</script>

</body>
</html>