JavaScript SDK - Customizing a Timeline Panel Range Slider
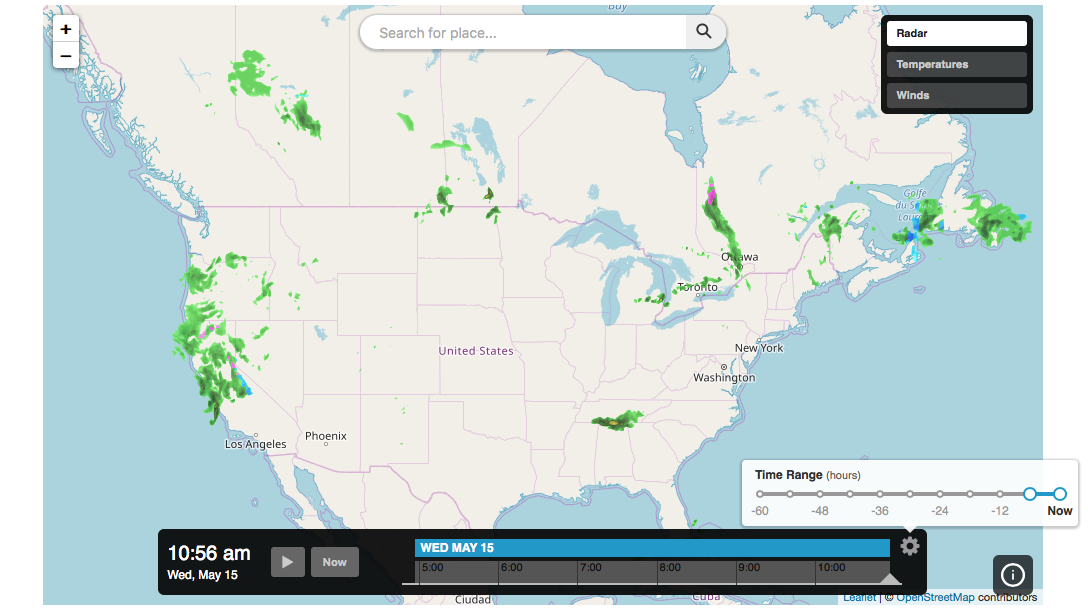
Render an interactive map application with a custom range for the timeline panel’s range slider options. The following example will display an interactive map application whose timeline panel range options are configured with a min/max of -60 hours to now and tick rendered every 6 hours.
<!DOCTYPE html>
<html>
<head>
    <meta charset="UTF-8">
    <title>Xweather JavaScript SDK - Interactive Map App w/Custom Timeline Options</title>
    <script defer src="https://cdn.aerisapi.com/sdk/js/latest/aerisweather.min.js"></script>
    <link rel="stylesheet" href="https://cdn.aerisapi.com/sdk/js/latest/aerisweather.css">

    <style>
    body {
        font-family: 'Helvetica','Arial',sans-serif;
    }
    #app {
        height: 600px;
        margin: 30px auto;
        width: 1000px;
    }
    </style>

</head>
<body>

<div id="app"></div>

<script>

    window.onload = () => {

        const aeris = new AerisWeather('CLIENT_ID', 'CLIENT_SECRET');
        const utils = aeris.utils;

        aeris.apps().then((apps) => {
            const map = new apps.InteractiveMapApp('#app', {
                map: {
                    strategy: 'leaflet',
                    zoom: 4,
                    timeline: {
                        from: -6 * 3600
                    },
                    layers: 'radar'
                },
                panels: {
                    layers: {
                        buttons: [{
                            id: 'radar',
                            value: 'radar:80',
                            title: 'Radar'
                        },{
                            id: 'temperatures',
                            value: 'temperatures:75,water-flat:blend(dst-out),states-outlines:50',
                            title: 'Temperatures'
                        },{
                            id: 'winds',
                            value: 'wind-speed:75',
                            title: 'Winds'
                        }]
                    },
                    timeline: {
                        range: {
                            // set the initial timeline offset range value
                            value: [-6, 0],

                            // set the min and max time offsets for the timeline range
                            range: {
                                min: -60,
                                max: 0
                            },

                            // define the tick labels that should be rendered along the slider
                            marks: {
                                '-60': '-60',
                                '-48': '-48',
                                '-36': '-36',
                                '-24': '-24',
                                '-12': '-12',
                                0: 'Now'
                            },

                            // the value interval to render tick marks for, e.g. every 6 hours
                            step: 6
                        }
                    }
                }
            });
        });

    };

</script>

</body>
</html>