JavaScript SDK - Plotting Xweather Weather API Data
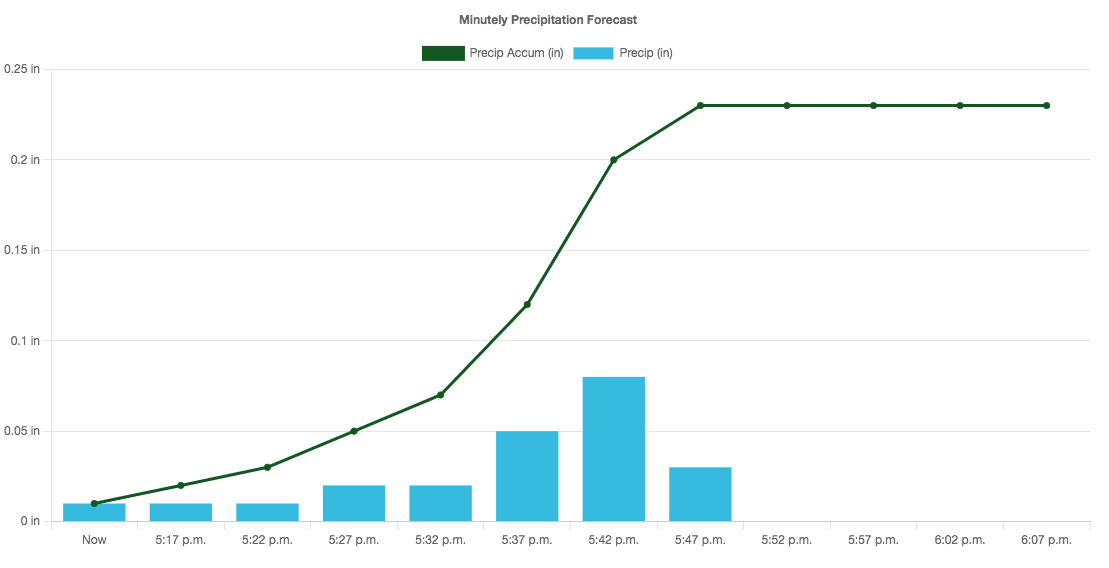
Request minutely precipitation from the conditions endpoint and plot data returned using Chart.js.
<!DOCTYPE html>
<html>
<head>
    <meta charset="UTF-8">
    <title>Xweather JavaScript SDK - Plotting API Data Using Chart.js</title>
    <script defer src="https://cdn.aerisapi.com/sdk/js/latest/aerisweather.min.js"></script>
    <script defer src="https://cdn.jsdelivr.net/npm/chart.js/dist/chart.min.js"></script>
    <script defer src="https://cdn.jsdelivr.net/npm/chartjs-adapter-date-fns/dist/chartjs-adapter-date-fns.bundle.min.js"></script>


    <style>
        .chart {
            width: 50%;
            height: 50%;
        }
    </style>

</head>
<body>
<div class="chart"><canvas id="canvas"></canvas></div>
<script>

    let precipArray;
    let timeArray;
    let precipAccum = 0.0;
    let precipAccumArray = [];
    let config;

    const chartColors = {
        precip: 'rgb(48, 187, 225)',
        precipAccum: 'rgb(15, 86, 30)',
    };

    window.onload = () => {

        const aeris = new AerisWeather('CLIENT_ID', 'CLIENT_SECRET');
        const request = aeris.api()
            .endpoint('conditions')
            .place('memphis,mi')
            .format('json')
            .filter('minutelyprecip,5min');

        request.get().then((result) => {
            const data = result.data[0];
            const {periods} = data;
            precipArray = data.periods.map(element => {
                precipAccum = precipAccum + element.precipIN;
                precipAccumArray.push(precipAccum);
                return element.precipIN;
            });
            timeArray = data.periods.map(element => element.dateTimeISO);

            //chart.js config
            config = {
                type: 'bar',
                data: {
                    //x-axes labels dataset
                    labels: timeArray,
                    //y-axes datasets
                    datasets: [{
                            label: "Precip (in)",
                            backgroundColor: chartColors.precip,
                            pointBackgroundColor: chartColors.precip,
                            data: precipArray,
                            fill: false,
                            order: 1,

                        },
                        {
                            label: "Precip Accum (in)",
                            backgroundColor: chartColors.precipAccum,
                            pointBackgroundColor: chartColors.precipAccum,
                            borderColor: chartColors.precipAccum,
                            data: precipAccumArray,
                            fill: false,
                            order: 0,
                            type: 'line'
                        }
                    ]
                },
                options: {
                    plugins: {
                        title: {
                            text: "Minutely Precipitation Forecast",
                            display: 'true'
                        }
                    },
                    responsive: true,
                    interaction: {
                        mode: 'x'
                    },
                    scales: {
                        x: {
                            type: 'time',
                            display: true,
                            time: {
                                tooltipFormat: "MMM d, yyyy h:mm a",
                                displayFormats: {
                                    hour: 'MMM yyyy'
                                },
                            },
                            grid: {
                                drawTicks: true,
                                drawOnChartArea: false,
                            },
                            ticks: {
                                drawTicks: true,
                                callback: function(value, index, values) {
                                    if (index === 0) {
                                        value = 'Now';
                                    }
                                    return value;
                                }
                            },
                        },
                        y: {
                            display: true,
                            ticks: {
                                callback: function(value) {
                                    return `${value} in`;
                                },
                                lineWidth: 10,
                            }
                        }
                    }
                }
            };
            const ctx = document.getElementById("canvas").getContext('2d');
            const myChart = new Chart(ctx, config);
        });
    };
</script>

</body>
</html>