JavaScript SDK - Create a Custom GeoJSON Source
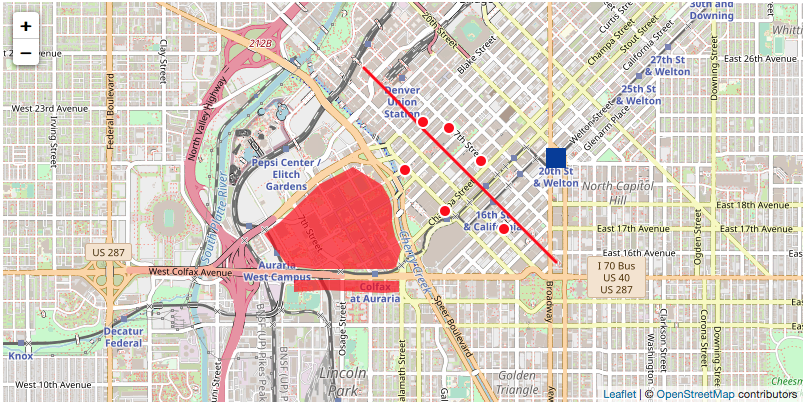
Create custom GeoJSON content sources using local and remote data and add it to an interactive map. The following example will add two separate GeoJSON sources to the map – one using local GeoJSON object and the other loading GeoJSON data from a remote source.
<!DOCTYPE html>
<html>
<head>
    <meta charset="UTF-8">
    <title>Xweather JavaScript SDK - Interactive Map with Custom GeoJSON Data</title>
    <script defer src="https://cdn.aerisapi.com/sdk/js/latest/aerisweather.min.js"></script>
    <link rel="stylesheet" href="https://cdn.aerisapi.com/sdk/js/latest/aerisweather.css">

    <style>
    #map {
        height: 400px;
        margin: 30px auto;
        width: 800px;
    }
    </style>

</head>
<body>

<div id="map"></div>

<script>

    const geoJsonData = {
        type: 'FeatureCollection',
        features: [{
            geometry: {
                type: 'Point',
                coordinates: [
                    -104.9998241,
                    39.7471494
                ]
            },
            type: 'Feature',
            properties: {
                popupContent: 'This is a B-Cycle Station. Come pick up a bike and pay by the hour. What a deal!'
            },
            id: 51
        },{
            geometry: {
                type: 'Point',
                coordinates: [
                    -104.9983545,
                    39.7502833
                ]
            },
            type: 'Feature',
            properties: {
                popupContent: 'This is a B-Cycle Station. Come pick up a bike and pay by the hour. What a deal!'
            },
            id: 52
        },{
            geometry: {
                type: 'Point',
                coordinates: [
                    -104.9963919,
                    39.7444271
                ]
            },
            type: 'Feature',
            properties: {
                popupContent: 'This is a B-Cycle Station. Come pick up a bike and pay by the hour. What a deal!'
            },
            id: 54
        },{
            geometry: {
                type: 'Point',
                coordinates: [
                    -104.9960754,
                    39.7498956
                ]
            },
            type: 'Feature',
            properties: {
                popupContent: 'This is a B-Cycle Station. Come pick up a bike and pay by the hour. What a deal!'
            },
            id: 55
        },{
            geometry: {
                type: 'Point',
                coordinates: [
                    -104.9933717,
                    39.7477264
                ]
            },
            type: 'Feature',
            properties: {
                popupContent: 'This is a B-Cycle Station. Come pick up a bike and pay by the hour. What a deal!'
            },
            id: 57
        },{
            geometry: {
                type: 'Point',
                coordinates: [
                    -104.9913392,
                    39.7432392
                ]
            },
            type: 'Feature',
            properties: {
                popupContent: 'This is a B-Cycle Station. Come pick up a bike and pay by the hour. What a deal!'
            },
            id: 58
        },{
            geometry: {
                type: 'Point',
                coordinates: [
                    -104.9788452,
                    39.6933755
                ]
            },
            type: 'Feature',
            properties: {
                popupContent: 'This is a B-Cycle Station. Come pick up a bike and pay by the hour. What a deal!'
            },
            id: 74
        },{
            type: 'Feature',
            geometry: {
                type: 'LineString',
                coordinates: [
                    [-105.00341892242432, 39.75383843460583],
                    [-105.0008225440979, 39.751891803969535]
                ]
            },
            properties: {
                popupContent: 'This is a free bus line that will take you across downtown.',
                underConstruction: false
            },
            id: 1
        },{
            type: 'Feature',
            geometry: {
                type: 'LineString',
                coordinates: [
                    [-105.0008225440979, 39.751891803969535],
                    [-104.99820470809937, 39.74979664004068]
                ]
            },
            properties: {
                popupContent: 'This is a free bus line that will take you across downtown.',
                underConstruction: true
            },
            id: 2
        },{
            type: 'Feature',
            geometry: {
                type: 'LineString',
                coordinates: [
                    [-104.99820470809937, 39.74979664004068],
                    [-104.98689651489258, 39.741052354709055]
                ]
            },
            properties: {
                popupContent: 'This is a free bus line that will take you across downtown.',
                underConstruction: false
            },
            id: 3
        },{
            type: 'Feature',
            properties: {
                popupContent: 'This is the Auraria West Campus'
            },
            geometry: {
                type: 'MultiPolygon',
                coordinates: [
                    [
                        [
                            [-105.00432014465332, 39.74732195489861],
                            [-105.00715255737305, 39.74620006835170],
                            [-105.00921249389647, 39.74468219277038],
                            [-105.01067161560059, 39.74362625960105],
                            [-105.01195907592773, 39.74290029616054],
                            [-105.00989913940431, 39.74078835902781],
                            [-105.00758171081543, 39.74059036160317],
                            [-105.00346183776855, 39.74059036160317],
                            [-105.00097274780272, 39.74059036160317],
                            [-105.00062942504881, 39.74072235994946],
                            [-105.00020027160645, 39.74191033368865],
                            [-105.00071525573731, 39.74276830198601],
                            [-105.00097274780272, 39.74369225589818],
                            [-105.00097274780272, 39.74461619742136],
                            [-105.00123023986816, 39.74534214278395],
                            [-105.00183105468751, 39.74613407445653],
                            [-105.00432014465332, 39.74732195489861]
                        ],[
                            [-105.00361204147337, 39.74354376414072],
                            [-105.00301122665405, 39.74278480127163],
                            [-105.00221729278564, 39.74316428375108],
                            [-105.00283956527711, 39.74390674342741],
                            [-105.00361204147337, 39.74354376414072]
                        ]
                    ],[
                        [
                            [-105.00942707061768, 39.73989736613708],
                            [-105.00942707061768, 39.73910536278566],
                            [-105.00685214996338, 39.73923736397631],
                            [-105.00384807586671, 39.73910536278566],
                            [-105.00174522399902, 39.73903936209552],
                            [-105.00041484832764, 39.73910536278566],
                            [-105.00041484832764, 39.73979836621592],
                            [-105.00535011291504, 39.73986436617916],
                            [-105.00942707061768, 39.73989736613708]
                        ]
                    ]
                ]
            }
        }]
    };

    window.onload = () => {

        const aeris = new AerisWeather('CLIENT_ID', 'CLIENT_SECRET');
        const utils = aeris.utils;

        aeris.views().then(views => {
            const map = new views.InteractiveMap(document.getElementById('map'), {
                center: {
                    lat: 39.745,
                    lon: -105.00
                },
                zoom: 14
            });

            // setup custom GeoJSON data source and styling using local GeoJSON data
            const customGeoJson = new views.datasources.GeoJson('custom-geojson', {
                data: {
                    items: geoJsonData
                },
                style: {
                    marker: {
                        svg: {
                            shape: {
                                type: 'circle',
                                fill: {
                                    color: '#ff0000'
                                },
                                stroke: {
                                    color: '#ffffff',
                                    width: 2
                                }
                            }
                        },
                        size: [16, 16]
                    },
                    polygon: {
                        fill: {
                            color: '#ff0000',
                            opacity: 0.7
                        }
                    },
                    polyline: {
                        stroke: {
                            color: '#ff0000',
                            width: 3
                        }
                    }
                }
            });

            // setup custom GeoJSON data source and styling using a remove GeoJSON url
            const remoteGeoJson = new views.datasources.GeoJson('geojson-remote', {
                data: {
                    url: '//www.aerisweather.com/docs/js/examples/stations.geojson',
                },
                style: {
                    marker: {
                        svg: {
                            shape: {
                                type: 'rect',
                                fill: {
                                    color: '#00399b'
                                }
                            }
                        },
                        size: [20, 20]
                    }
                }
            });

            map.on('ready', () => {
                map.addSource(customGeoJson);
                map.addSource(remoteGeoJson);
            });
        });
    };

</script>

</body>
</html>