JavaScript SDK - Customize an Interactive Map Point Layer
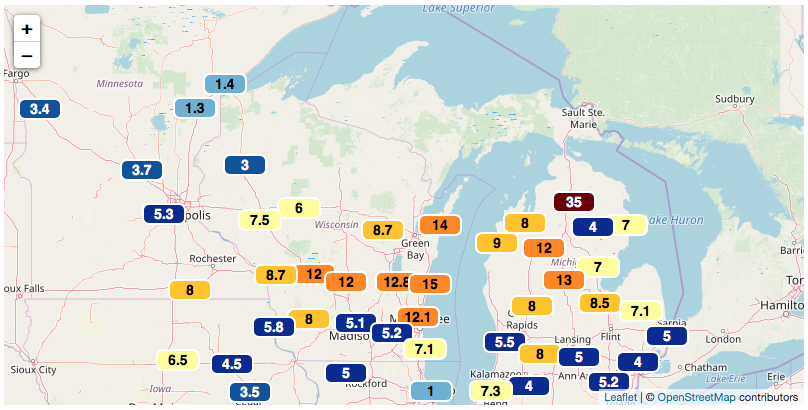
Customize a stormreports point layer with just snow-related reports and custom marker styling using shields. The following example will render snow report totals across the Great Lakes region for the past 24 hours using custom marker styling.
Note that there are several levels of customization for this snow reports layer:
- customize the request parameters to only return snow-related storm reports
- return a custom style for each marker that consists of a background rectangle colored based on the report amount and the amount value as a text label
- customize the content displayed in each marker’s callout popup
<!DOCTYPE html>
<html>
<head>
    <meta charset="UTF-8">
    <title>Xweather JavaScript SDK - Custom Point Styles on Interactive Map</title>
    <script defer src="https://cdn.aerisapi.com/sdk/js/latest/aerisweather.min.js"></script>
    <link rel="stylesheet" href="https://cdn.aerisapi.com/sdk/js/latest/aerisweather.css">

    <style>
    #map {
        height: 400px;
        margin: 30px auto;
        width: 800px;
    }
    </style>

</head>
<body>

<div id="map"></div>

<script>

    // our color code ranges for the snow report badges
    const colorRanges = [
        [0, 1, "BDD7E7"],
        [1, 2, "6BAED6"],
        [2, 3, "3182BD"],
        [3, 4, "08519C"],
        [4, 6, "082694"],
        [6, 8, "FFFF96"],
        [8, 12, "FFC400"],
        [12, 18, "FF8700"],
        [18, 24, "DB1400"],
        [24, 30, "9E0000"],
        [30, 36, "690000"],
        [36, 9999, "2B002E"]
    ];

    // function to determine the badge color based on the amount of snow & the colorRanges
    const determineColor = (val) => {
        let match;
        colorRanges.forEach(range => {
            const [min, max, color] = range;
            if (val >= min && val < max) {
                match = color;
            }
        });
        return match;

    };

    window.onload = () => {

        const aeris = new AerisWeather('CLIENT_ID', 'CLIENT_SECRET');

        aeris.views().then(views => {
            const map = new views.InteractiveMap(document.getElementById('map'), {
                center: {
                    lat: 44.977,
                    lon: -88.265
                },
                zoom: 6,
                timeline: {
                    from: -6 * 3600,
                    to: 0
                },
                layers: [{
                    layer: 'stormreports',
                    options: {
                        type: 'point',
                        request: {
                            parameters: {
                                filter: 'snow',
                                limit: 1000,
                                sort: 'detail:-1,dt:-1',
                                fields: 'id,loc,report'
                            }
                        },
                        data: {
                            properties: {
                                time: 'report.timestamp',
                                value: 'report.detail.snowIN'
                            }
                        },
                        style: {
                            marker: (data) => {
                                const amount = data.report.detail.snowIN;
                                const fillColor = `#${determineColor(amount)}`;
                                const textSize = 14;
                                const { width: w, height: h } = { width: 42, height: 20 };

                                return {
                                    svg: {
                                        shape: {
                                            type: 'rect',
                                            fill: {
                                                color: fillColor
                                            },
                                            stroke: {
                                                color: '#ffffff',
                                                width: 2
                                            },
                                            radius: 6
                                        },
                                        text: {
                                            position: 'center',
                                            value: amount,
                                            color: aeris.utils.colors.isLight(fillColor) ? '#000000' : '#ffffff',
                                            size: 14,
                                            style: 'bold',
                                            autosize: false
                                        }
                                    },
                                    size: [w, h],
                                    spacing: 30,
                                    callout: () => {
                                        if (data) {
                                            const { report: { timestamp, name, comments }} = data;
                                            const formattedDate = aeris.utils.dates.format(new Date(timestamp * 1000), 'MMM D, YYYY h:mm a');
                                            return (`
                                                <strong>Snow Report${amount ? ` - ${amount} in` : ''}</strong><br/>
                                                ${name}<br/>${formattedDate}<br/>${comments}
                                            `);
                                        }
                                        return null;
                                    }
                                }
                            }
                        }
                    }
                }]
            });
        });
    };

</script>

</body>
</html>