We don't always appreciate how much weather forecasts have improved over the years. By 2020, we could predict the weather five days ahead with the same accuracy as a one-day forecast in 1980. AI is accelerating this progress, producing forecasts in minutes rather than hours and outperforming traditional numerical weather prediction models on many measures of skill.
For operations teams, this means more lead time and confidence when planning for the week ahead. But the challenge of translating the forecast into operational decisions remains.
A weather forecast combines dense layers of spatial and temporal information. Distilling that data down to operational impacts is no easy task. And the more sites you manage, the longer it takes to work out what the forecast means for the crews, schedules, and work at each site.
Xweather Protect helps you manage weather risk before, during, and after severe weather with forecasts, alerts, and reports. In this post, we’ll focus on preparing for severe weather with the Xweather Protect dashboard.
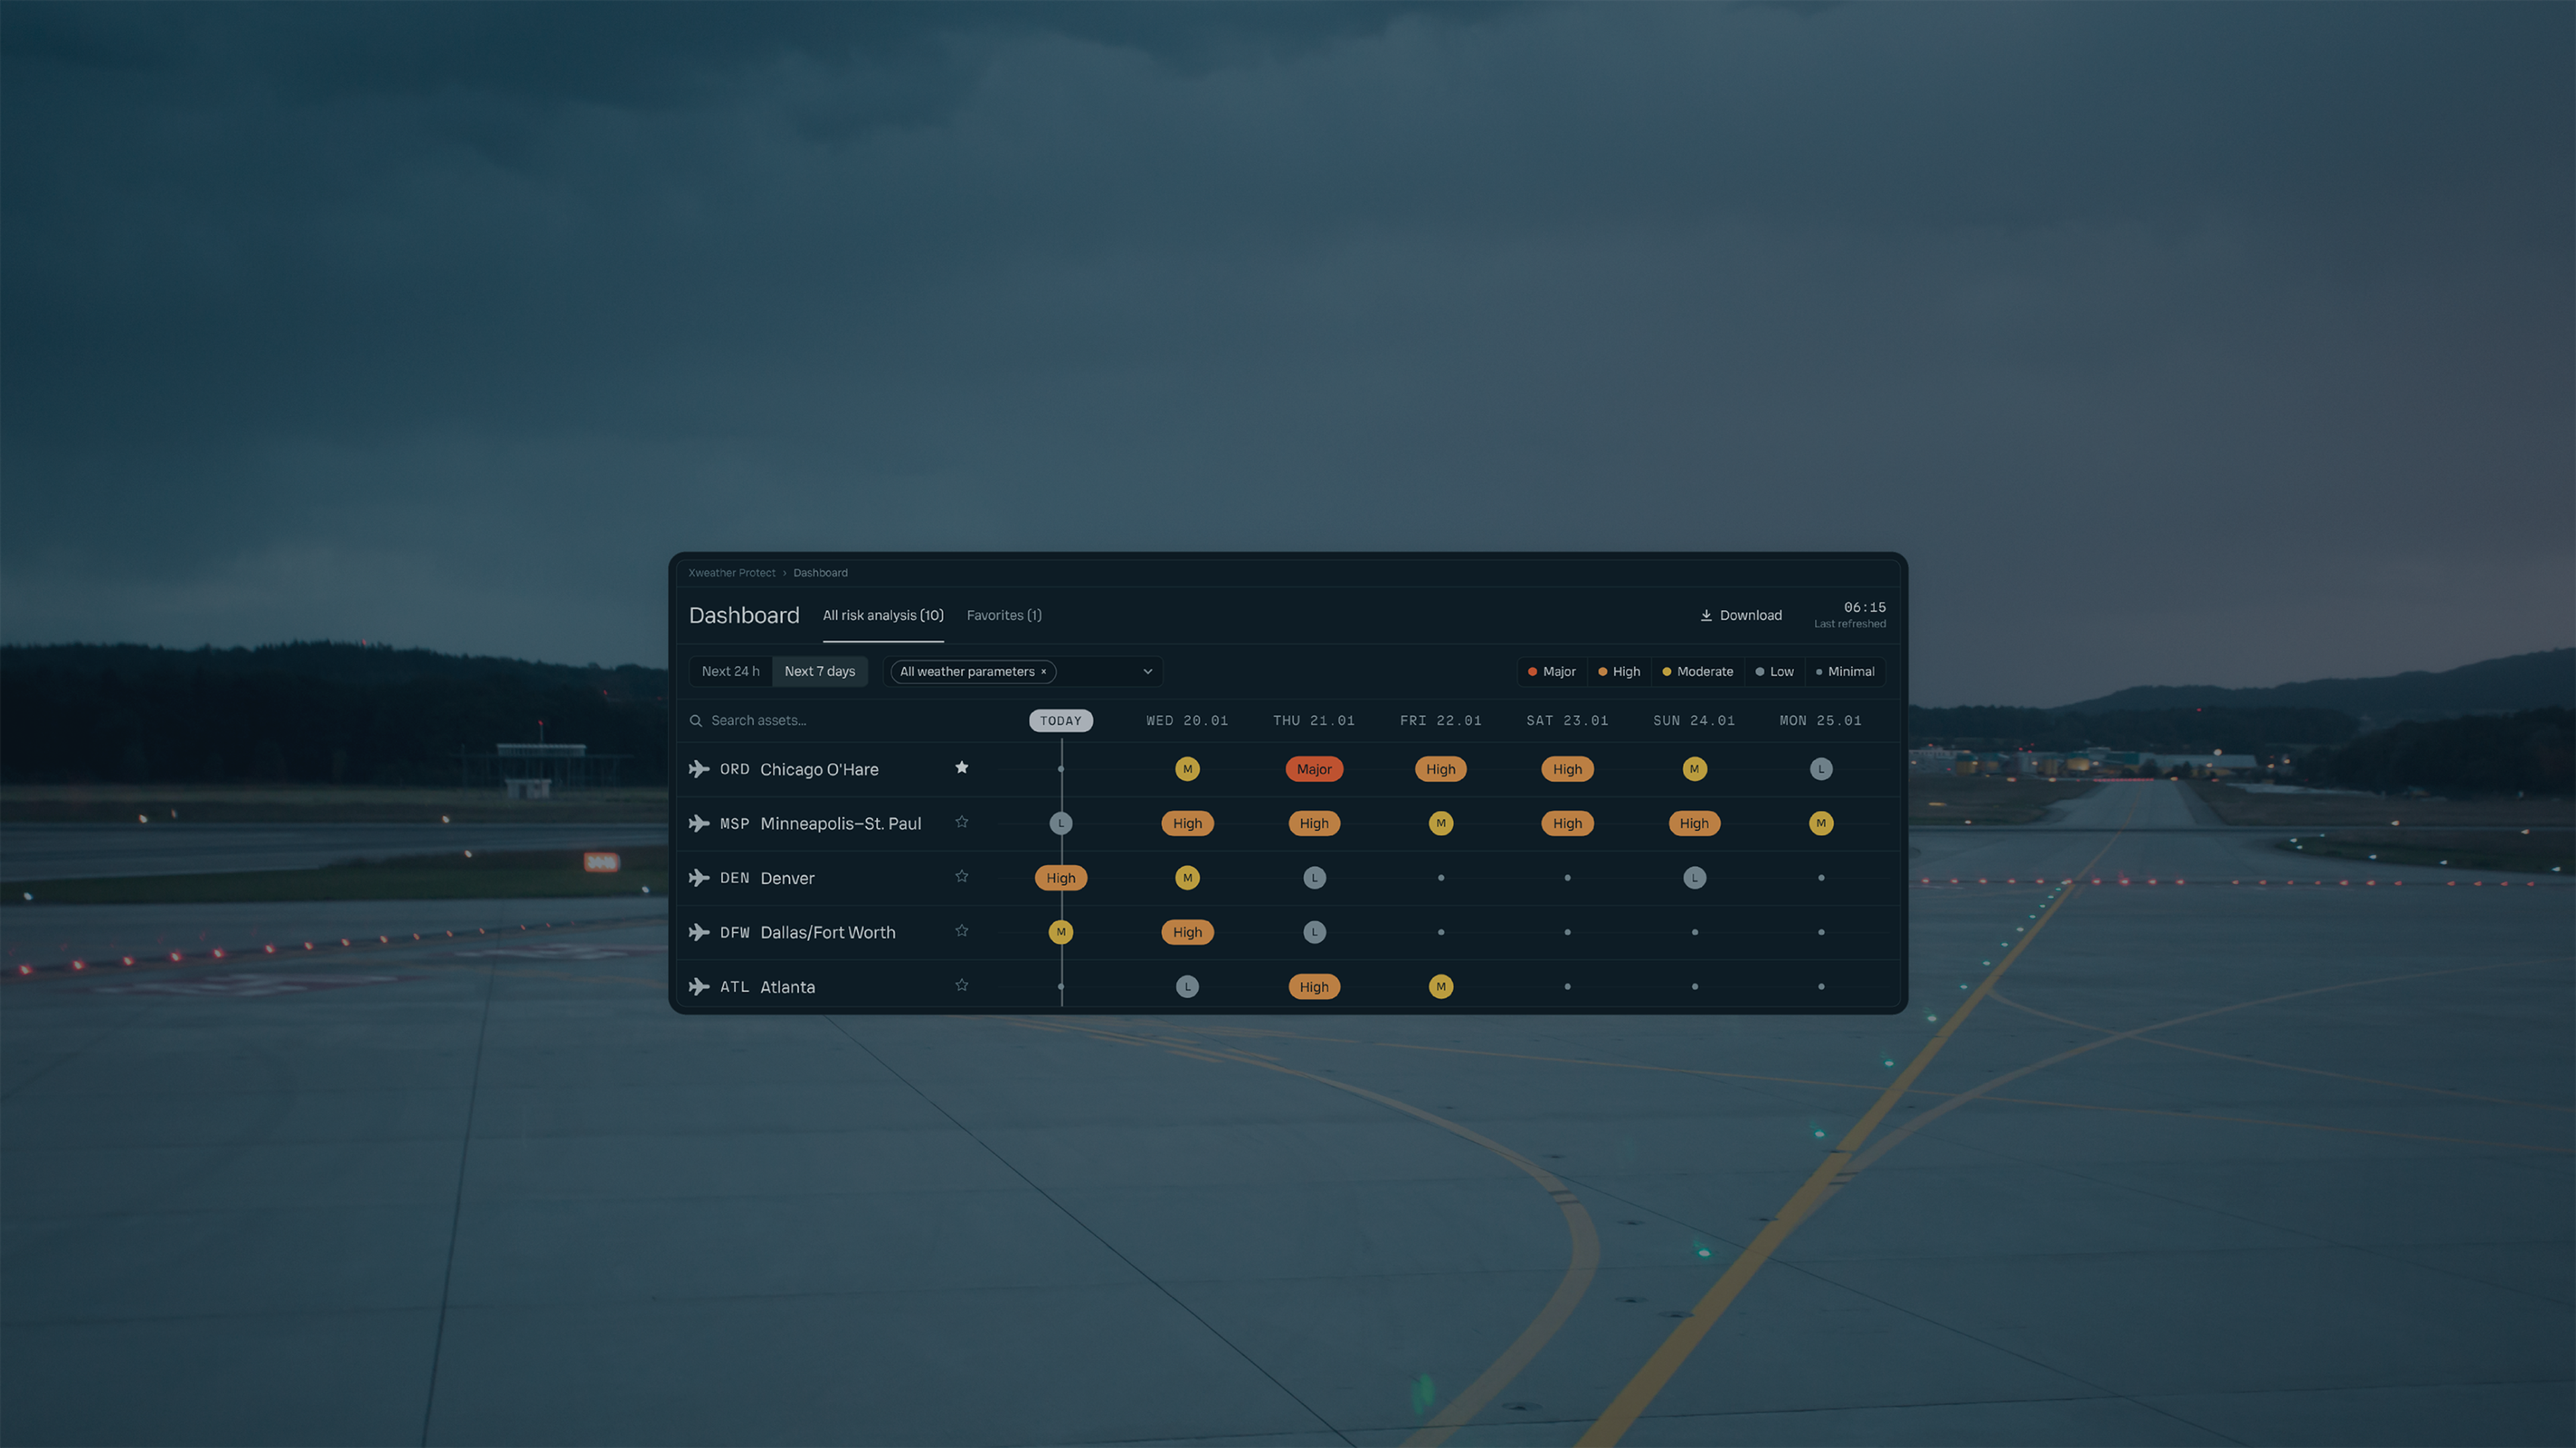
The dashboard shows forecasted weather risks across all your sites in one view. It helps teams managing multiple assets, locations, or service territories understand how the weather will impact operational decisions in the coming seven days.
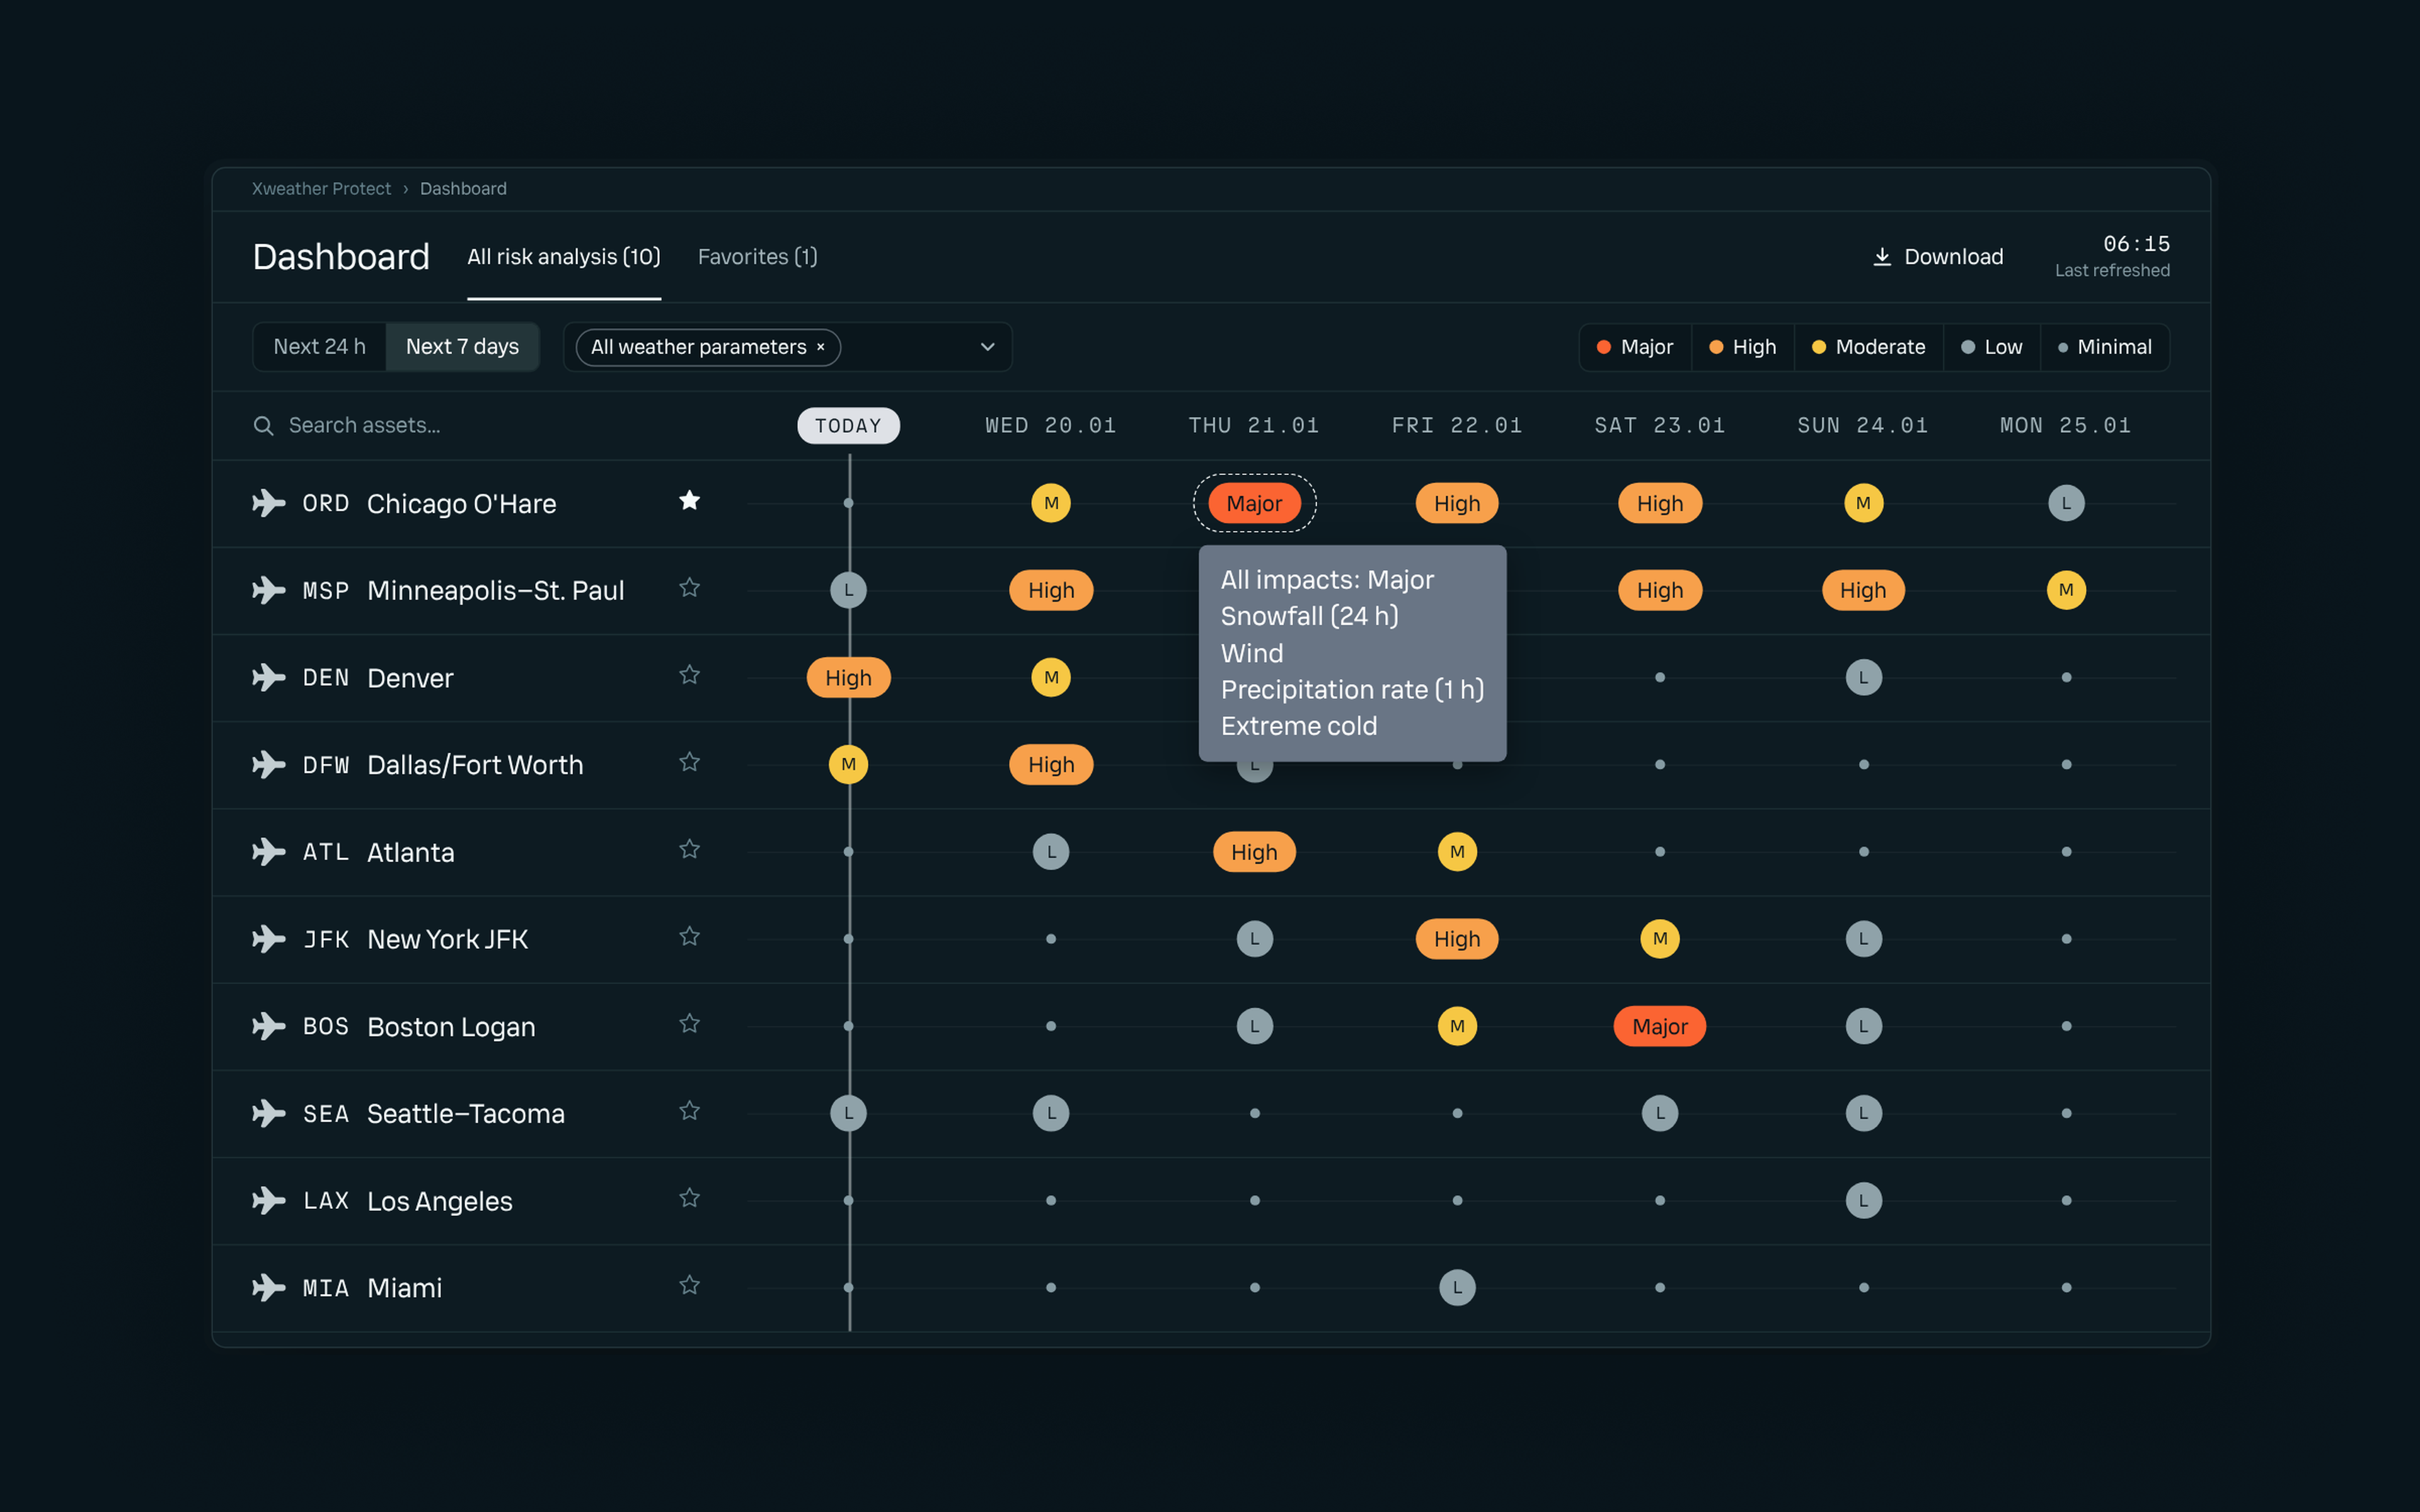
Seven days of weather risk for every site, updated every 15 minutes
The main view shows the daily forecasted weather risk for your assets over the next seven days. You can also choose to focus only on the hourly risks for the next 24 hours. The dashboard updates every 15 minutes for both the hourly and the seven-day views.
To support rapid assessment and decision-making, risks are rated as Minimal, Low, Moderate, High, or Major, with higher risk levels displayed more prominently in size and color. You can sort assets by severity on any day or hour, so that those with the highest risk appear at the top.
Each rating considers the risk from lightning and convective activity, wind, rainfall, snowfall, extreme heat and cold, and tropical cyclones. Hovering over a rating shows which parameters are driving the risk.
Filter by severity and weather type
The Xweather Protect dashboard adapts to your operational priorities with flexible filtering options. You can choose to see only High or Major risks, for example, by selectively hiding lower risk levels.
You can also choose which weather parameters contribute to the risk rating. For example, if lightning is the main threat to your personnel, you can hide the other parameters from the view and set up your dashboard to show only the risk of lightning at each site.
Detailed risk forecasts for each asset
Select any asset to open the asset view and see detailed risk forecasts and summaries for that location. This view helps teams plan for potential impacts in the coming hours or days.
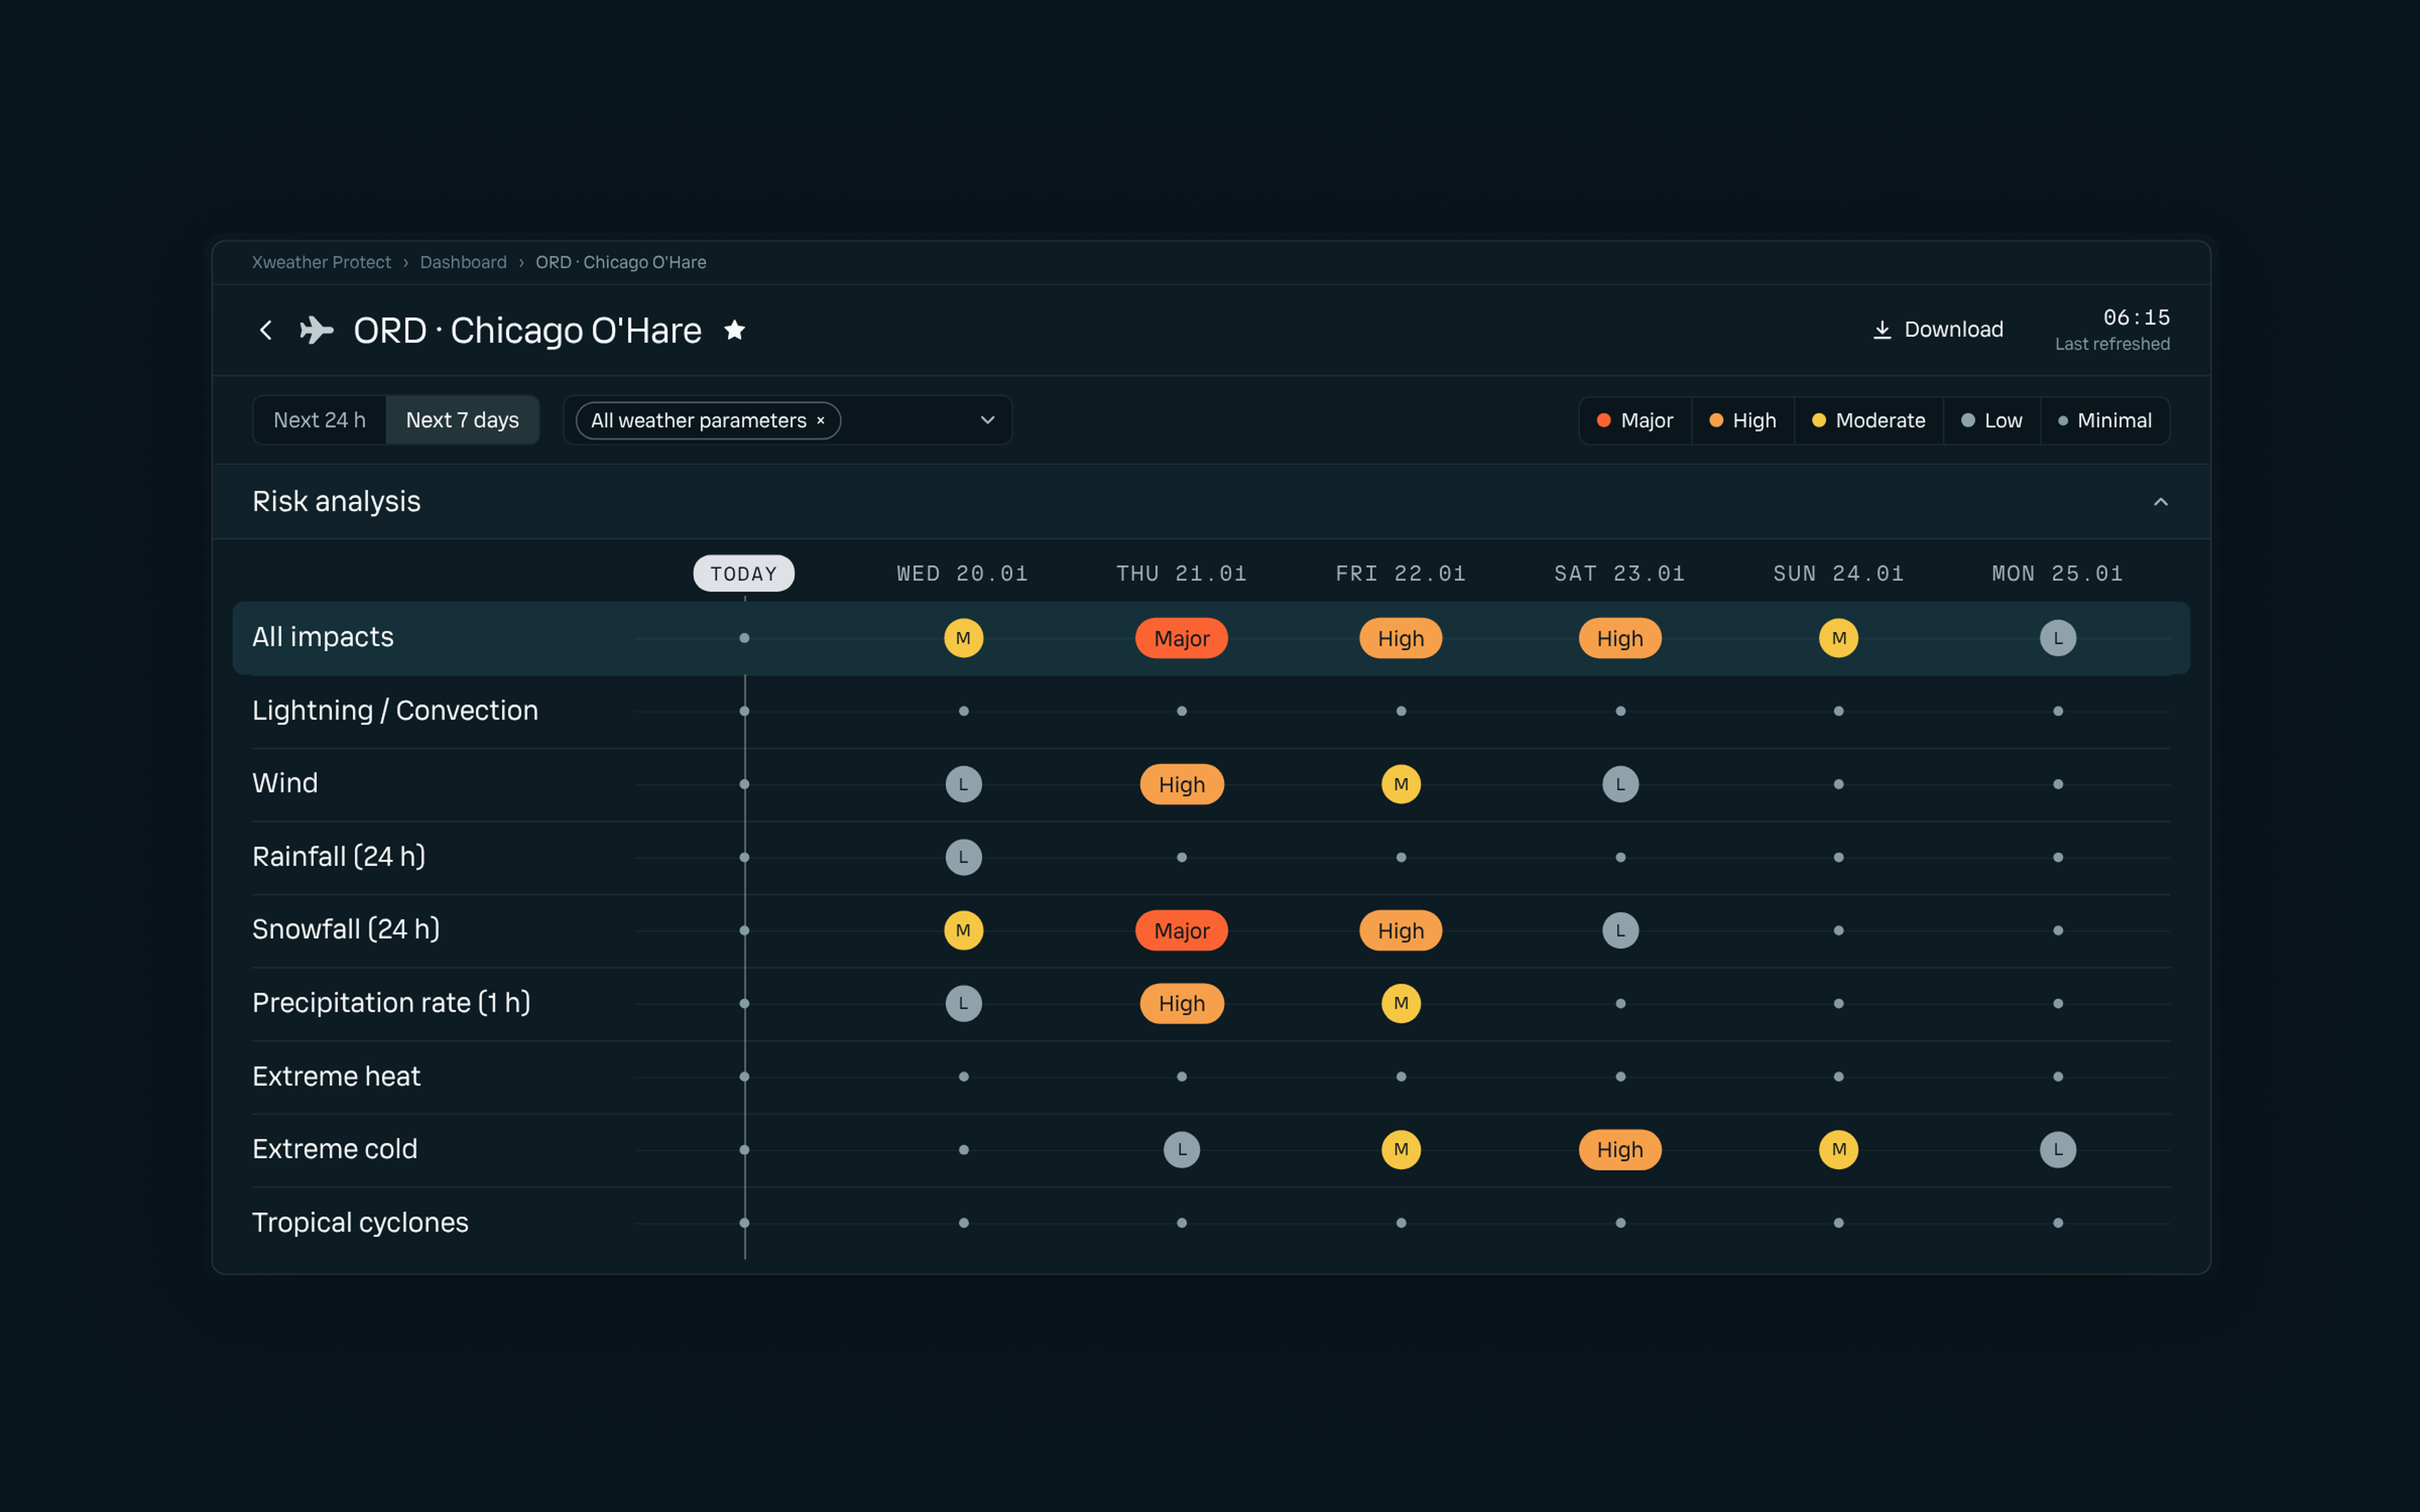
The Risk Analysis section shows the daily or hourly risk for each weather parameter. As with the main dashboard, you can filter the view by showing or hiding individual severity levels and weather parameters.
The Forecast Summary gives a plain-language written summary of the forecast for the location of the asset. When there is a risk, the summary describes what the weather means for working at the location. For example, “Postpone outdoor activity and seek shelter during the heavy rain; avoid strenuous activity and take precautions against heat.”
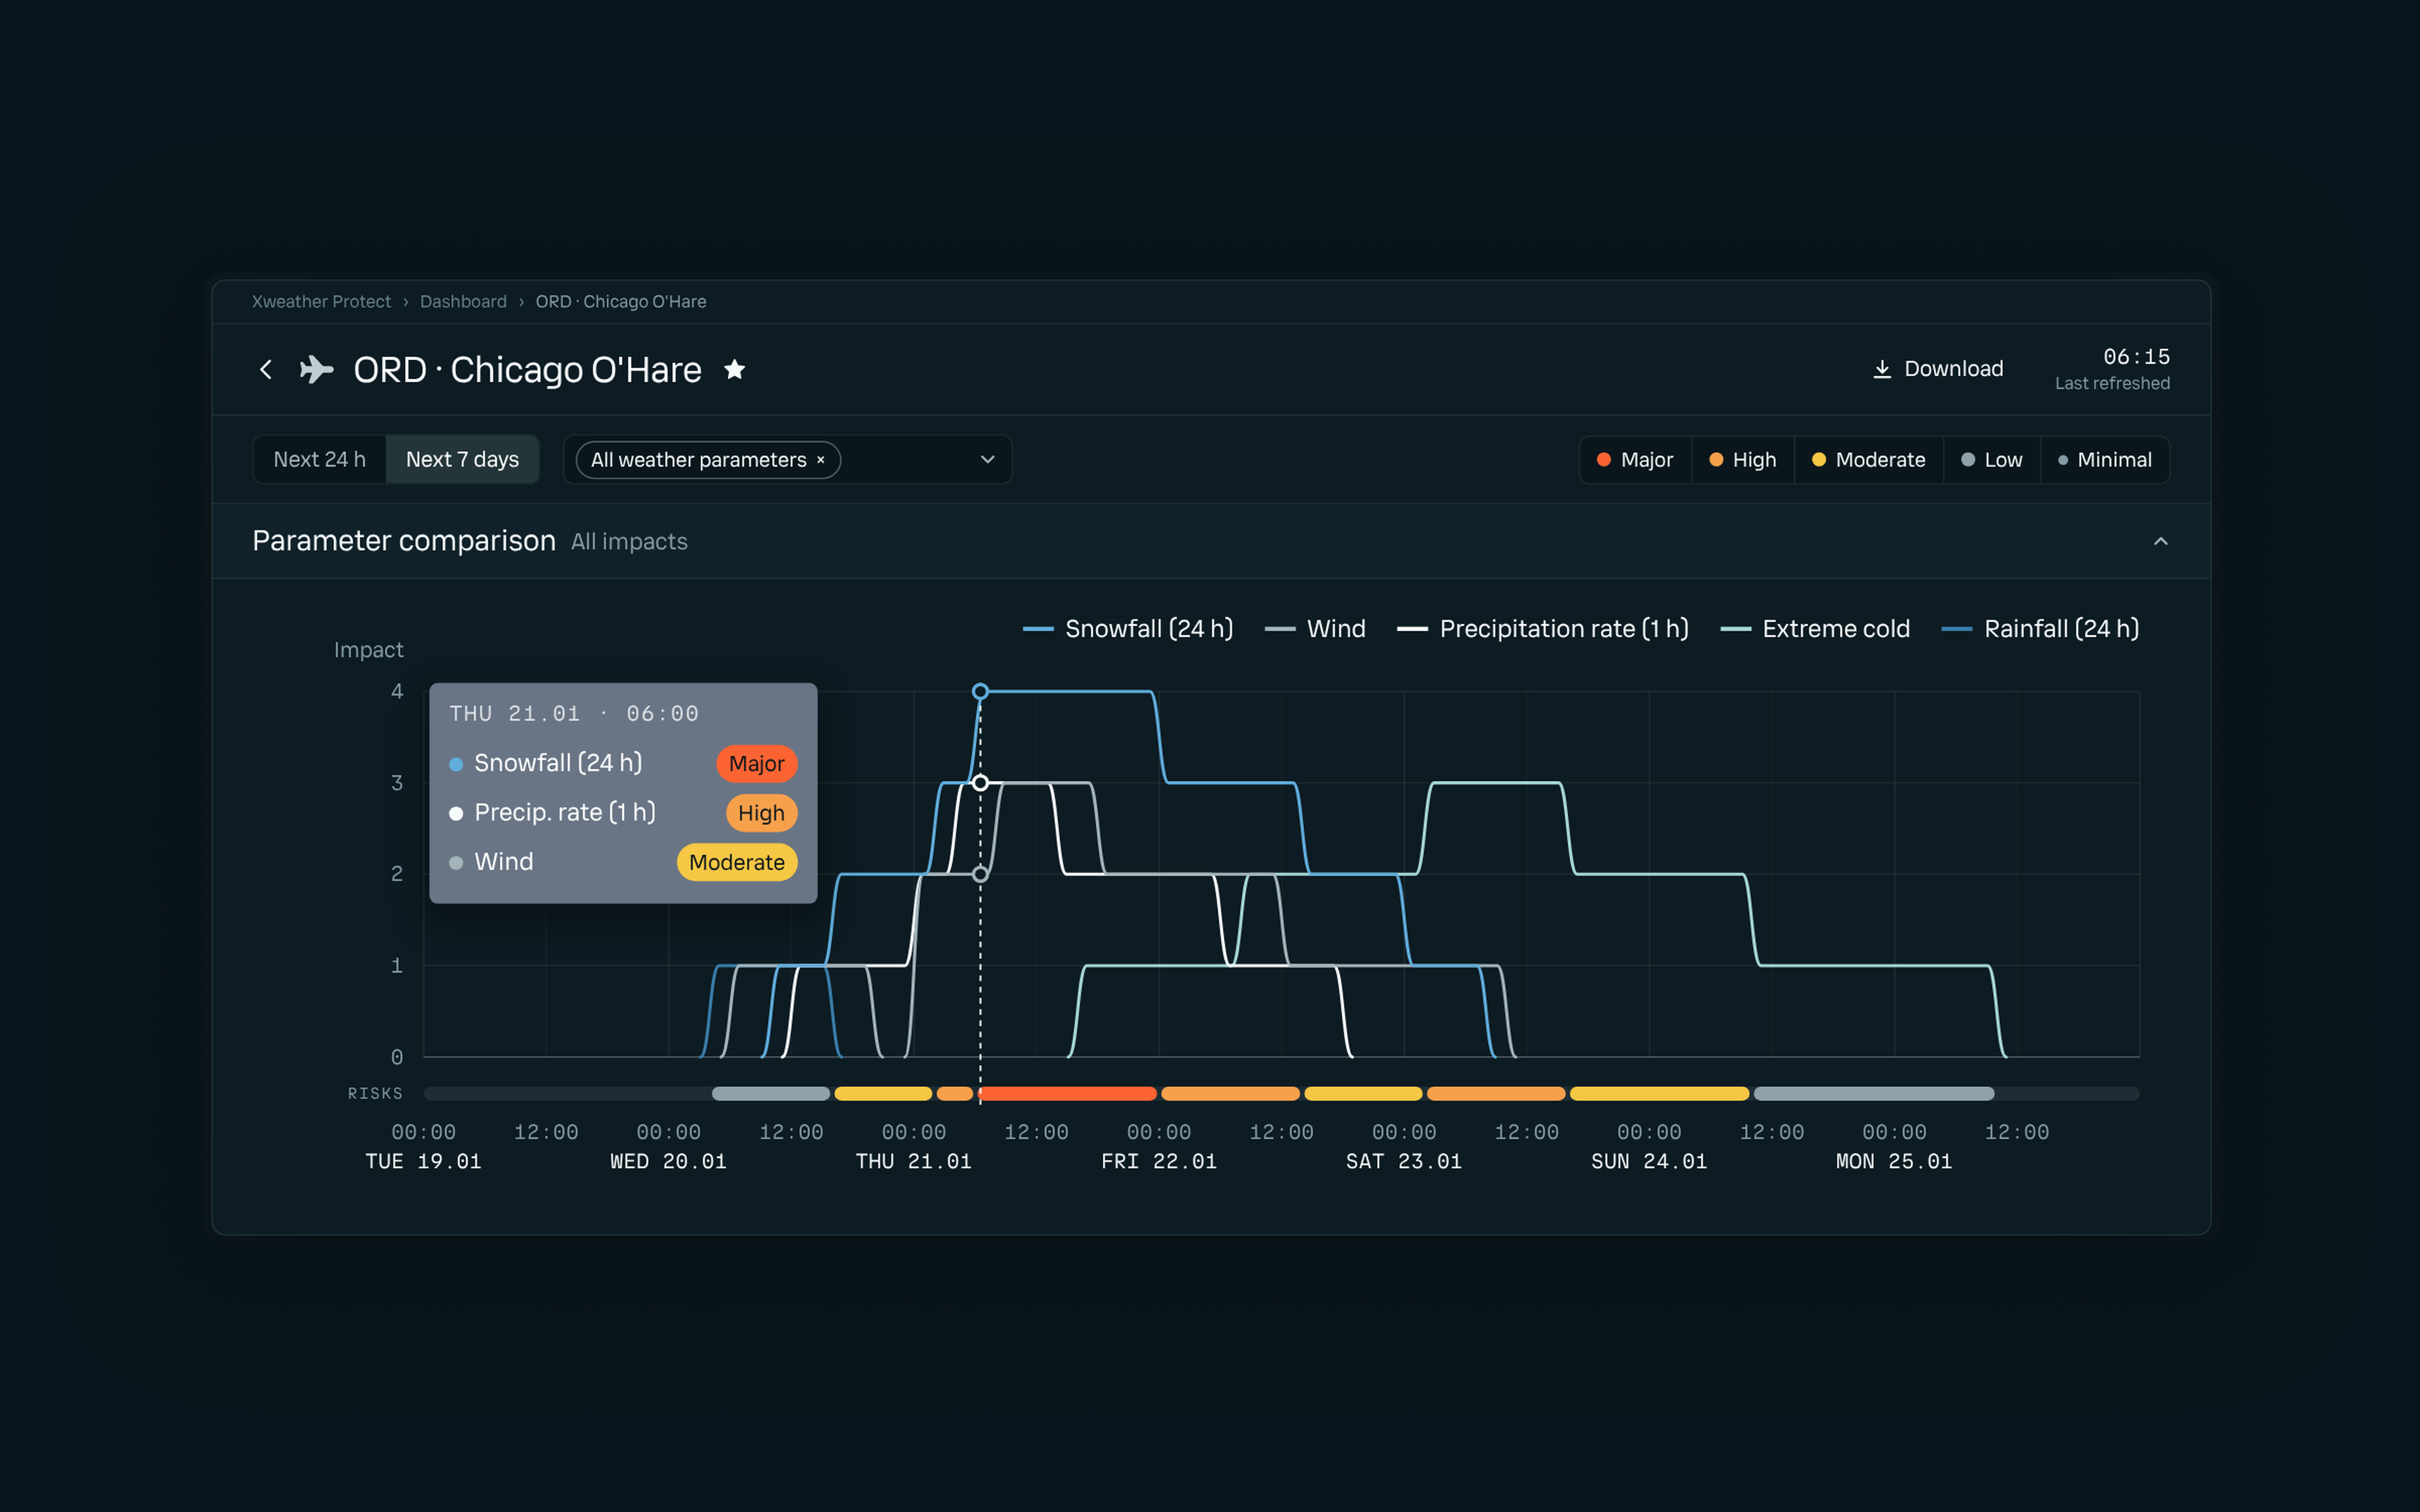
The Parameter Comparison section charts hourly risk levels for each parameter. As before, you can filter this view to show or hide individual parameters to match your operational priorities.
The Impacts & Signals section displays a table of daily risk ratings for each parameter, the overall impact rating, and the parameters driving that rating. The days with the highest and lowest risk are labeled. Each day can be expanded to show a full 24-hour breakdown of risk by the hour.
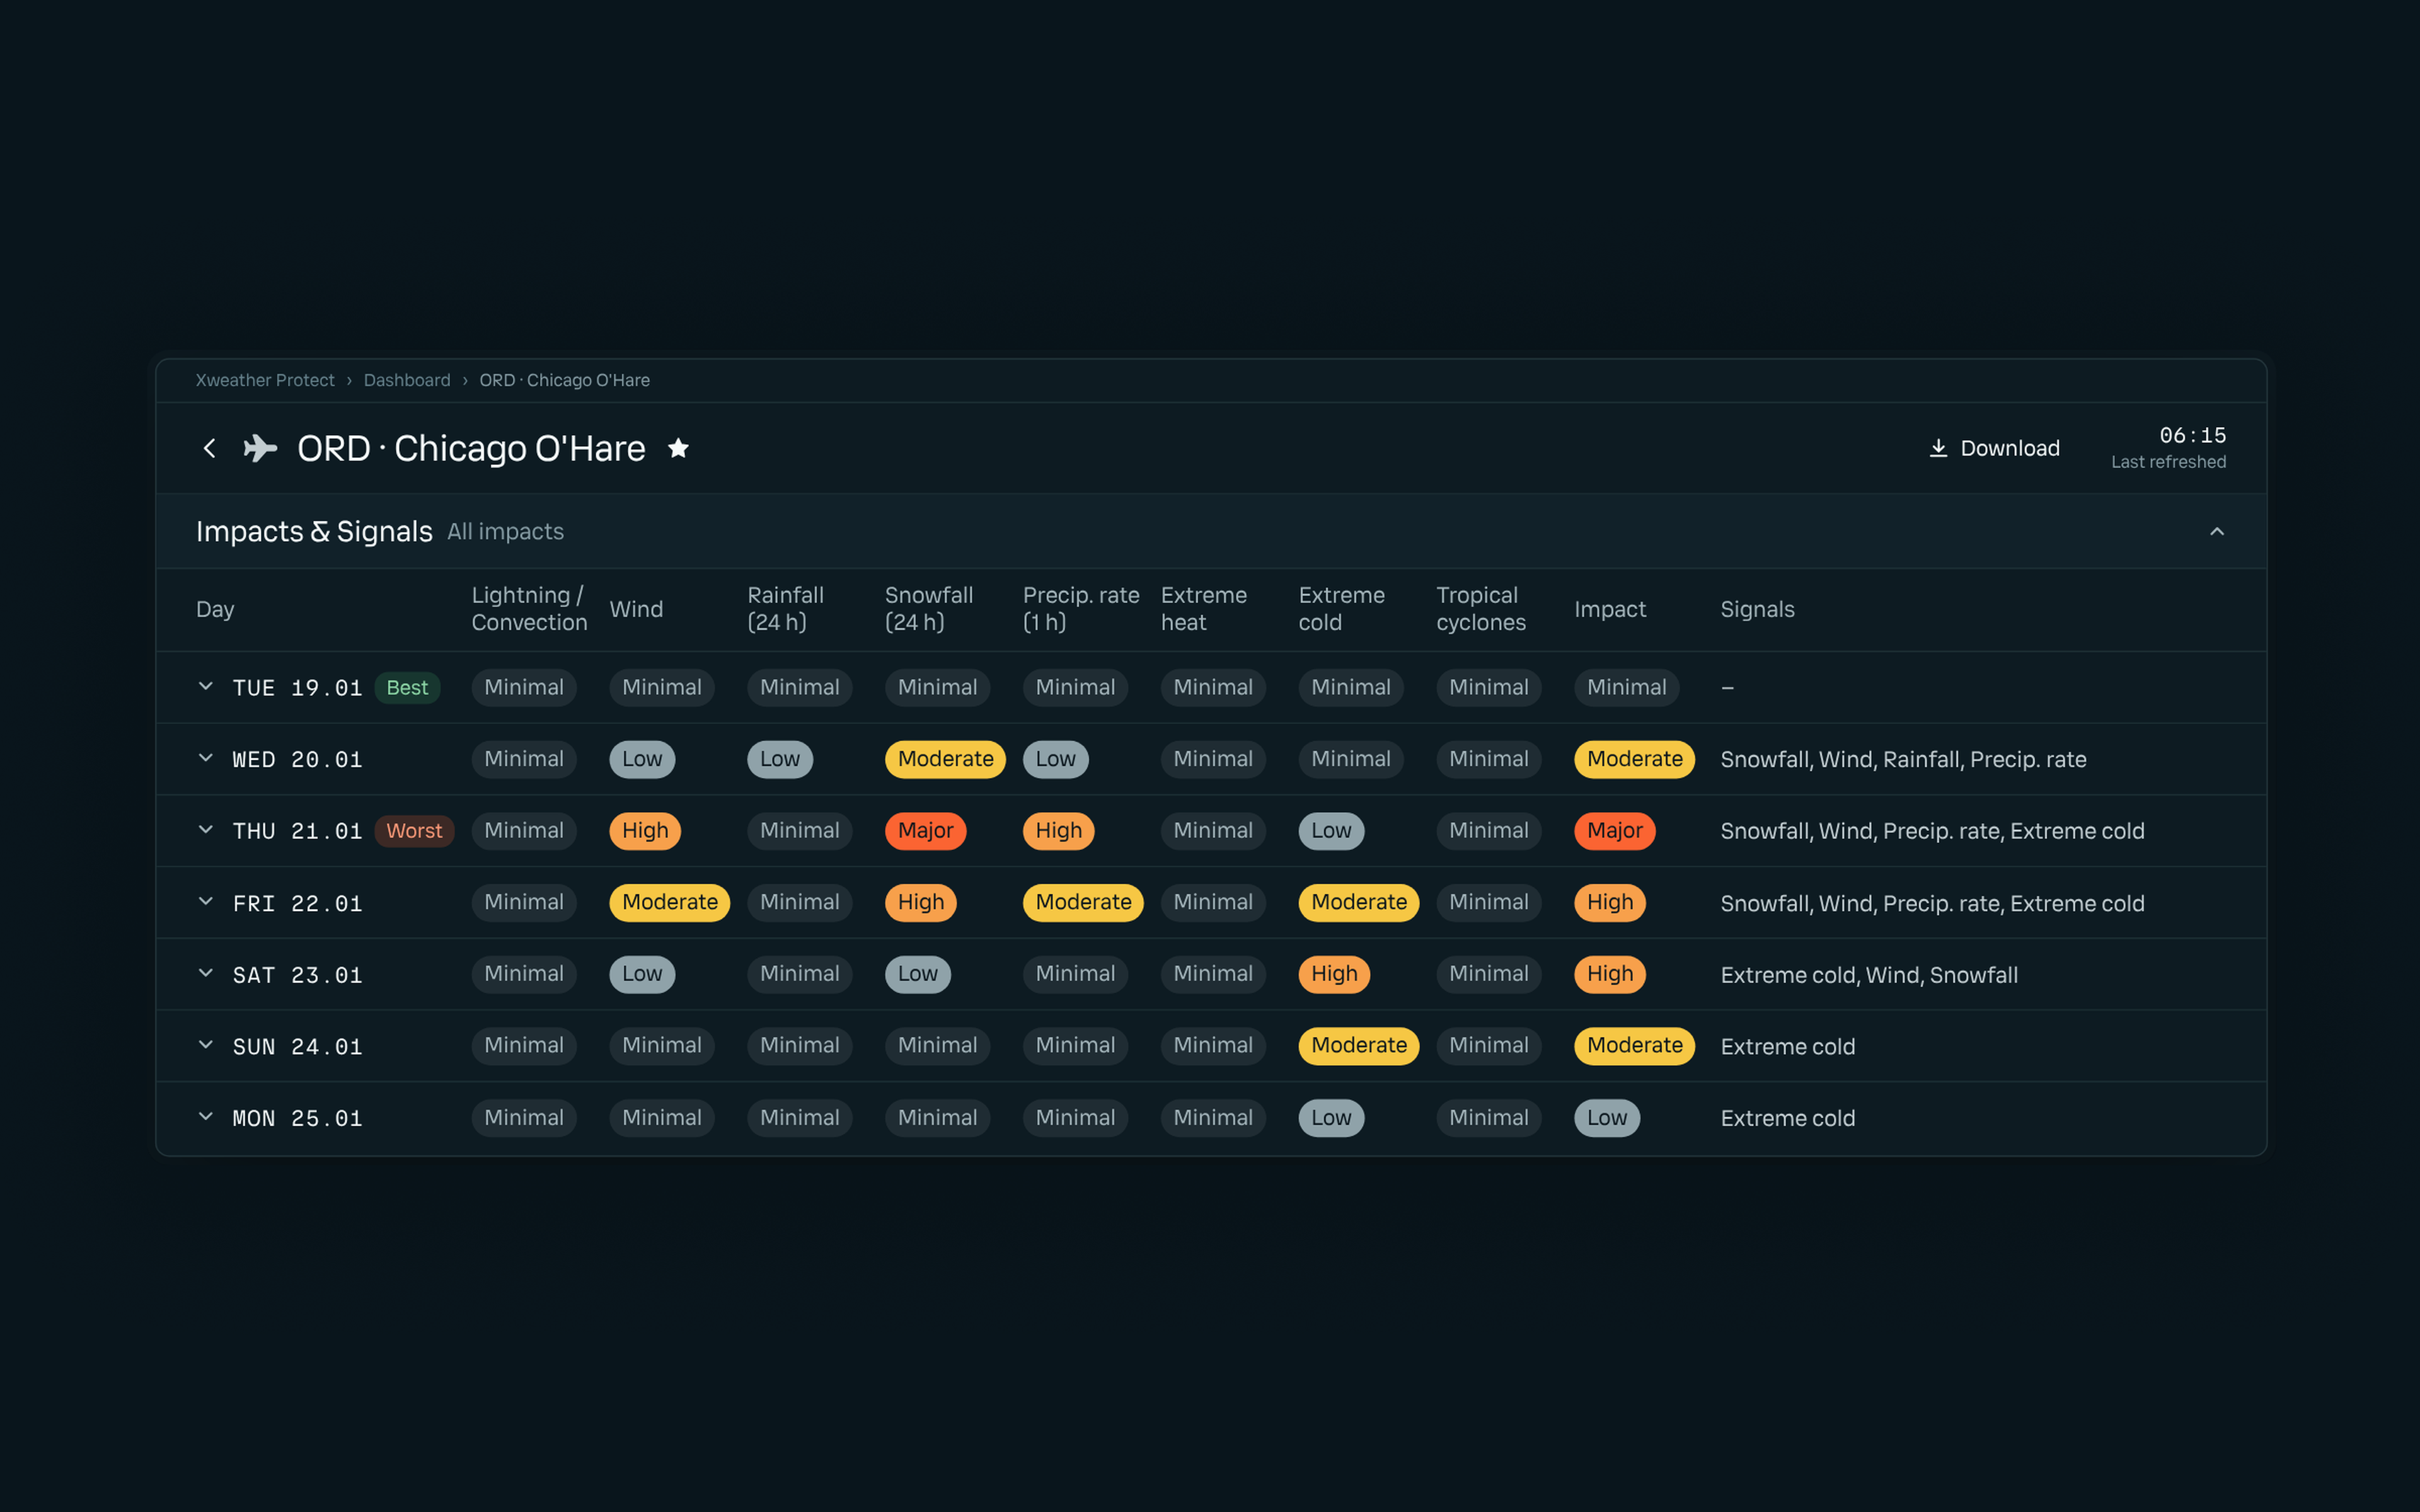
With these views, operations teams can decide days ahead where to stage crews, when to schedule or reschedule outdoor work, and when to put contingency plans into effect.
The purpose of the dashboard is to help operations teams anticipate and plan around severe weather, from the control room to the daily briefing call. That’s why we’ve made it easy to share with others. Both the main dashboard and the asset-specific view can be downloaded and shared as PDF files.
Severe weather safety before, during, and after the storm
In this post, we showed how the Xweather Protect dashboard helps teams prepare before severe weather hits. Xweather Protect also provides real-time monitoring and alerts when storms arrive and post-event reporting to prioritize inspections, validate decisions, and document events for compliance. Discover complete severe weather protection in one platform.