







Xweather risk analytics
Turn weather risk into a tradeable edge
- Supports full lifecycle of index-based weather risk contracts
- Covers weather, renewables, and environmental derivatives
- Handles both simple and highly complex deal structures
Index-based climate contracts and derivatives for insurers, banks, and energy trading desks across weather, renewable energy, and environmental markets.

Weather risk analytics
Our analytics platform gives your team the tools to price, hedge, and settle weather-indexed instruments with institutional-grade precision, built for the speed of modern energy markets.
- 25 +
years of expertise
- $ 20 billion+
of risk transferred
- 1+ million+
weather contracts priced
- 5 million
lines of code
40% of Fortune 100 rely on Xweather
Pricing, hedging and settlement on one platform
Weather risk analytics brings together the data, models, and execution tools that energy trading, reinsurance and brokers teams need to price, manage, and settle weather-indexed risk.
- Custom weather indices
- Portfolio VaR & P&L tracking
- Automated settlement & fixing
Xweather data, trading desk precision
Weather risk analytics combines world-leading meteorological datasets with advanced pricing engines and portfolio risk analytics built for professional energy, financial, and insurance markets.
Backed by 25 years of proven expertise as the established market standard, our platform delivers trusted data paired with the institutional-grade infrastructure required to price, structure, and manage weather and climate risk globally.
Turn weather exposure into market advantage
Weather risk analytics serves energy traders, risk managers, and portfolio managers across the full weather derivatives workflow.
Weather risk pricing
Weather risk pricing & analytics
Weather risk can’t be captured by static climatological averages. Professional markets need the full shape of the underlying distributions. Weather risk analytics supports multi-variable indices — including temperature, precipitation, snowfall, wind, solar irradiance, and custom energy-linked parameters — to mirror physical and financial exposure.
Models are built on quality-controlled surface observations and reanalysis data. Detrending separates structural climate trends and station relocations from short-term noise. Rigorous automated and manual data cleaning pipelines segregate structural climate trends and station relocations from high-frequency noise using advanced detrending algorithms.
Monte Carlo simulations show the full range of possible outcomes, and bias-corrected ensemble forecasts sharpen the short- and medium-term view. These scenarios feed directly into derivative pricing: burn cost, Greeks such as delta, and loss exceedance curves. The result: risk priced the way it’s actually realized.
Portfolio risk intelligence
Portfolio risk intelligence
Managing a weather risk portfolio takes continuous visibility across every active position. Live deal booking and real-time P&L set the baseline, while Daily VaR, Expiry VaR and Greek sensitivities quantify exposure across every instrument.
Weather and energy events are non-linear and spatially linked, so portfolio dependencies are modeled with copulas rather than simple correlation matrices. This captures tail dependencies and cross-regional contagion during extreme events. Counterparty credit risk is tracked too: potential future exposure and current exposure are monitored against credit limits, taking collateral and netting sets into account.
Concentration risks are surfaced early, and diversification benefits can be weighed across stations, zones and energy-linked asset classes. Hedging and trading strategies are evaluated with stochastic dominance and full distribution profiling, not mean-variance metrics alone. The result: a clear basis for balancing risk, capital and return.
Settlement lifecycle
Settlement lifecycle & audit governance
From final weather observation to final cash settlement, the platform enforces an uncompromised, automated operational lifecycle. Verified observational data and settlement indices automatically trigger precise calculation pipelines. The system processes complex payout functions, generates batch invoicing, and structures multi-currency cash-flow projections to ensure seamless clearing and settlement operations.
Granular user permissions, role-based access controls, and an immutable event log record every system action, valuation override, and trade modification. This guarantees complete lifecycle traceability from initial deal capture to final payment.
Designed to meet institutional governance standards, the platform provides audit-ready reporting to support global regulatory obligations. Comprehensive system exports, multi-currency conversion engines, and flexible data structures provide total transparency for complex, cross-border portfolios.

Built on 25+ years of proven methodology
Price any weather risk
Custom indices, Monte Carlo simulations, and structured product valuation give you institutional-grade pricing for any weather-linked instrument.
Manage risk across your whole book
Copula engines and real-time VaR tracking across all positions replace fragmented spreadsheets with a single portfolio command center.
Settle with full audit trail
Automated fixing, dual-source data verification, and a log of every user action mean each contract resolves from verified data, ready for audit.
Your models, your edge
Upload proprietary power curves and proxy revenue formulas, or connect your quants' Python and C# tools through the Data API, so the platform reflects your exposure, not a generic market proxy.
Weather risk analytics gives you a full trading desk capability, from market onboarding through live position management.
01
Deploy
Deploy seamless single-tenant architecture on-premise within your own IT infrastructure or leverage fully managed, secure cloud hosting provided by Vaisala Xweather.
02
Integrate
Automated data pipelines and high-throughput REST APIs streamline data exports and cross-platform sharing, ensuring effortless integration into downstream trading, risk, and accounting systems.
03
Trade
Structure, price, and model complex weather and environmental derivatives using industry-benchmark valuation methods refined and proven across global financial markets for over 25 years.
04
Settle
Eliminate operational risk and settlement delays with automated calculation engines, strict data governance, and audit-ready compliance tracking across the full trade lifecycle.
Institutional grade pricing
Build custom weather indices and run Monte Carlo simulations to price any instrument with the rigour of a dedicated derivatives desk.
Full portfolio visibility
Real-time P&L, Daily VaR, and Copula correlation engines give you a live command centre view across every open position.
Models built around your book
Upload proprietary power curves and proxy revenue formulas so every simulation reflects your specific exposure, not a generic benchmark.
Settlement you can audit
Automated fixing, dual-source data verification, and timestamped logs ensure every contract resolves accurately and stands up to regulatory scrutiny.
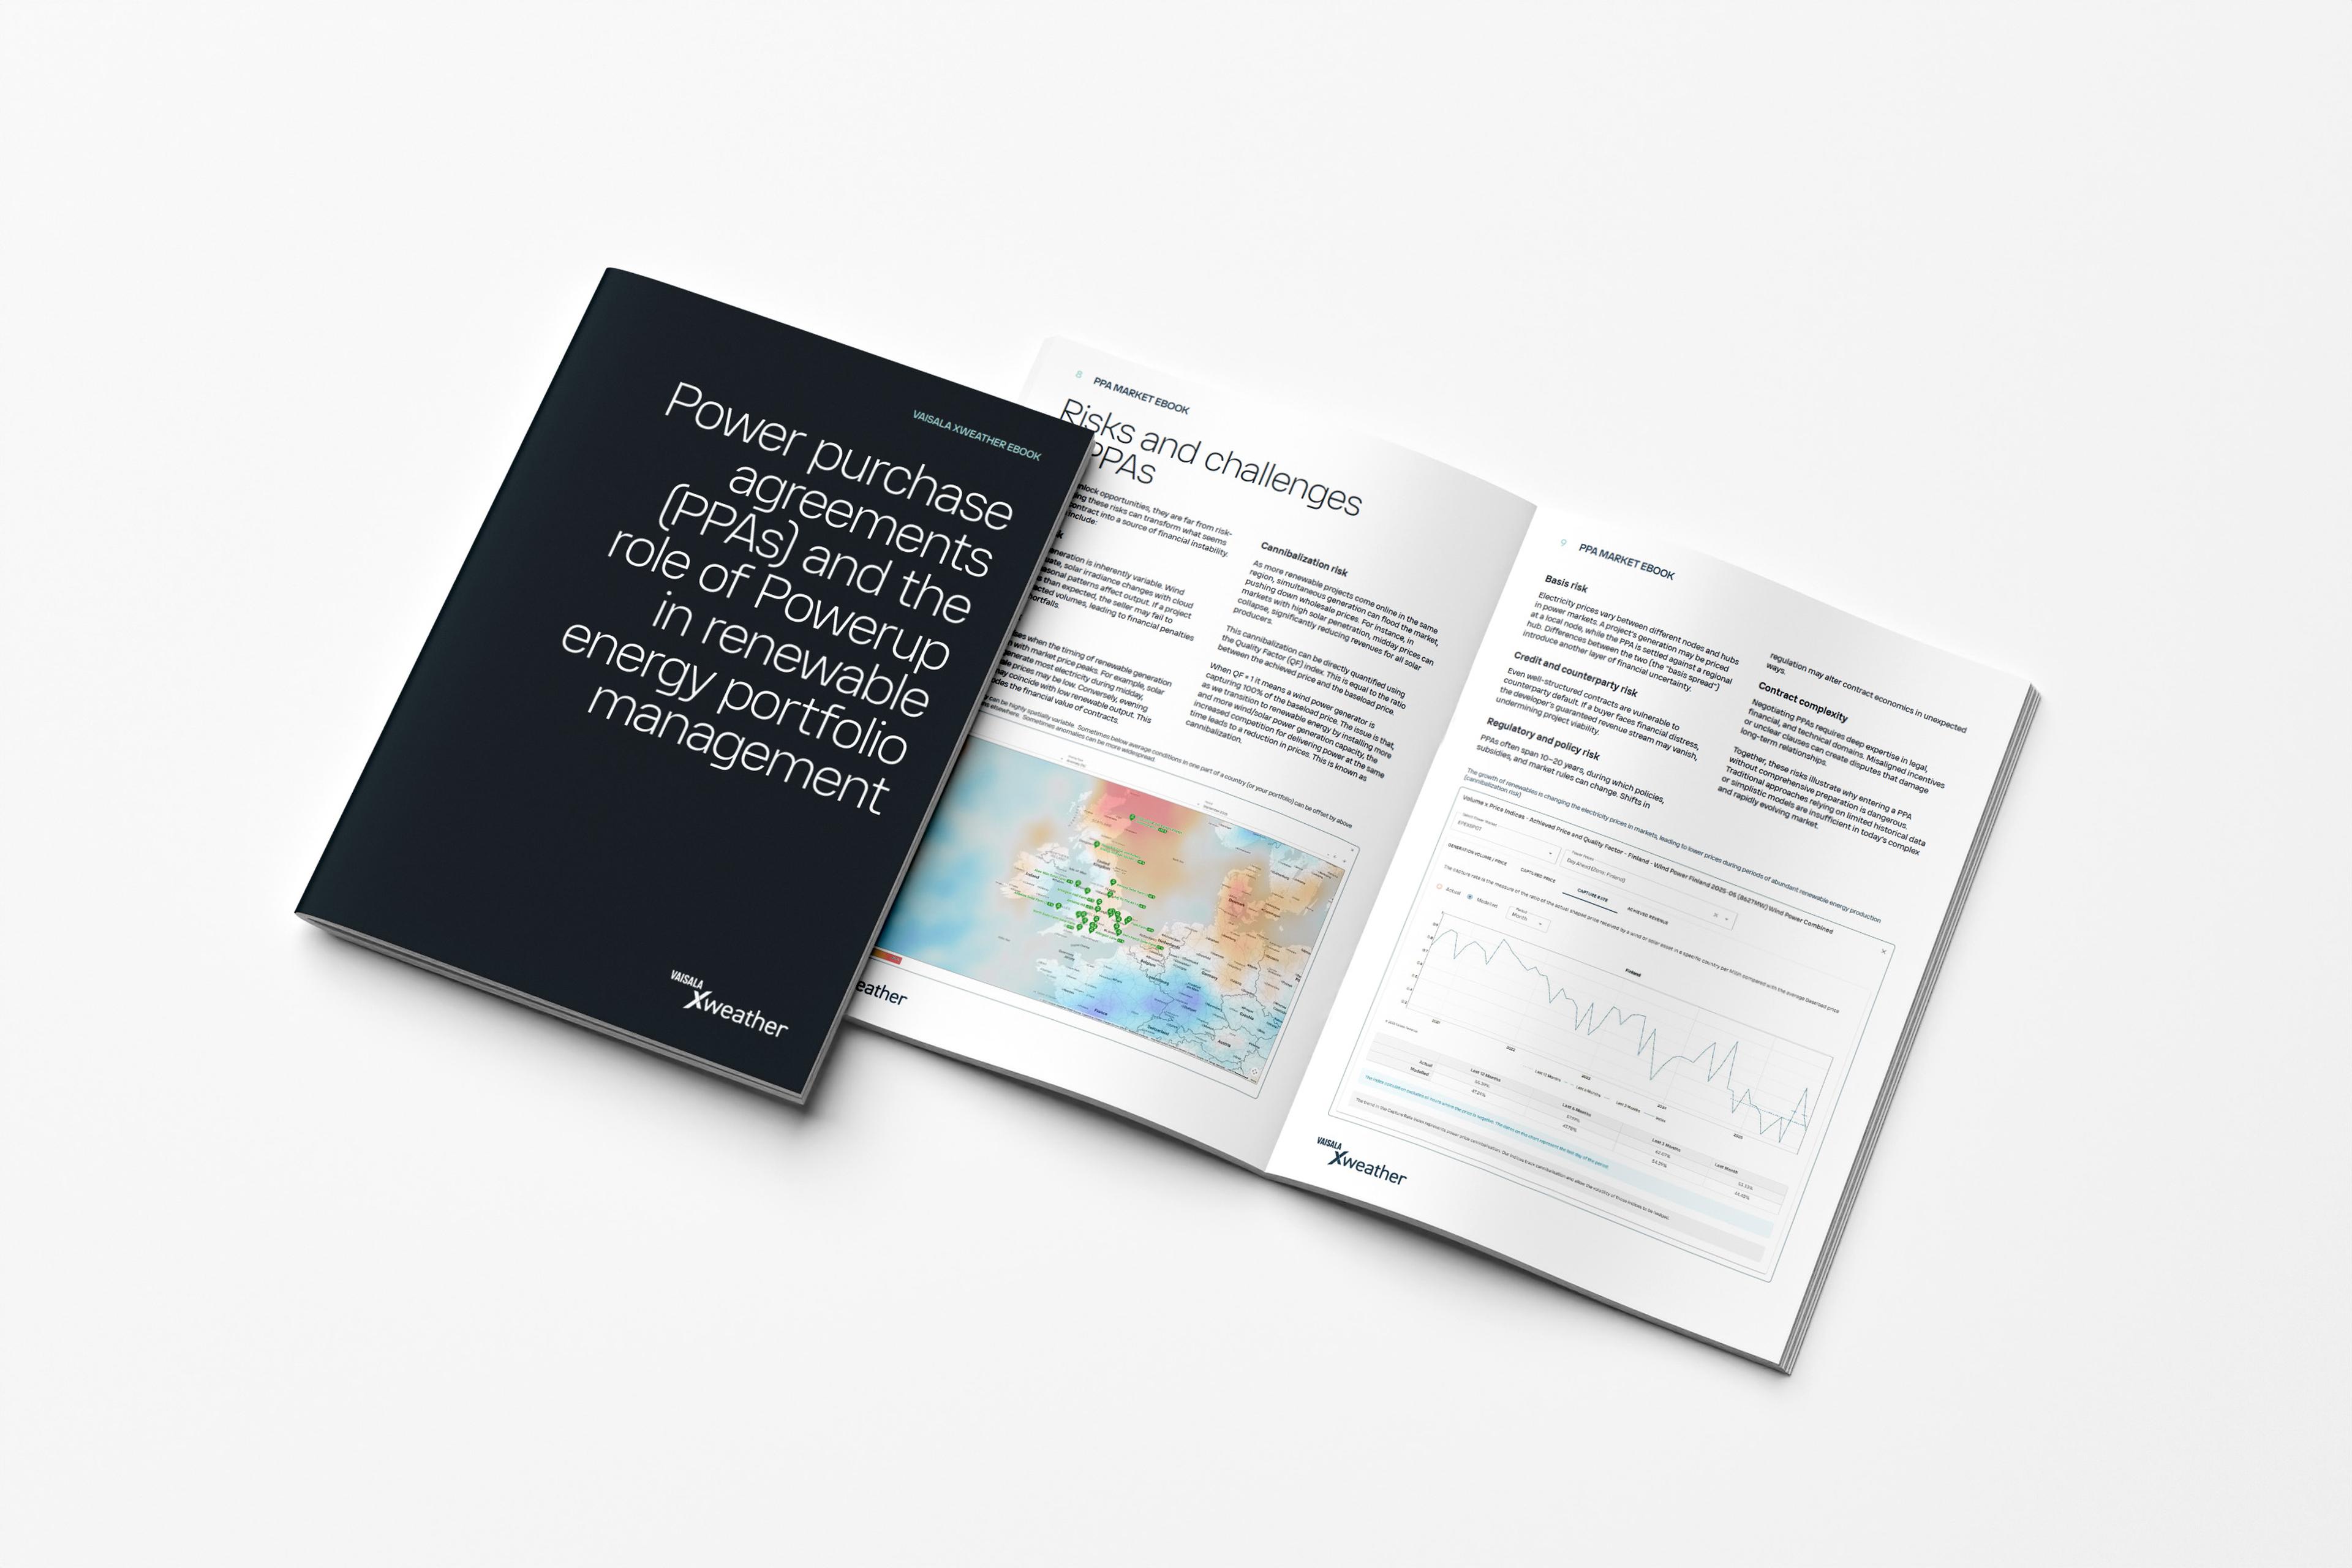
Related resource: A practical guide for PPA decision-making
A comprehensive overview of the Power Purchase Agreement (PPA) market and the critical role of portfolio-level analysis.
Sign up for a demo
Book a personalized demo with our team and explore how the Weather risk analytics platform can support your business.
- Built on Speedwell index expertise
- Covers wind and solar
- Customizable hedging and analytics

Frequently asked questions
Weather risk analytics covers pricing, portfolio risk, and settlement for climate risk contracts, from standard HDD and CDD hedges to baskets, multi-year strips, gas quantos, and renewable PPAs. It works across temperature, rainfall, wind, solar, and other environmental variables, with commodity and power prices held alongside weather data.
The platform uses Speedwell's quality-controlled weather and renewable-energy indices to structure, price, monitor, and settle climate risk contracts. Speedwell gridded data and forecast archives feed the database directly, and deal terms exchanged in the WeatherML format load straight from weatherXchange, ready to price.
Yes. Booked trades update P&L, Daily VaR, Expiry VaR, and simulations as new weather data and forecasts arrive, with update frequency set by your data feeds and reporting schedule. Middle office teams can stress-test the book with their own models without touching live trades.
Yes. Weather risk analytics brings contracts across locations, variables, and structures into one portfolio view, scaling to tens of thousands of weather sites. PCA, Markowitz charts, and stochastic dominance show aggregate exposure, concentrations, and diversification across global operations.
The database scales to tens of thousands of weather sites, down to minute-level data. The Data Manager automates historical and forecast feeds from multiple providers, and custom variables such as commodity prices, gas curves, and power price indices sit alongside weather data.