)
This post was originally published while Hurricane Hilary was live in August of 2023. It has since been modified to walk users through how to create demo views of active tropical cyclones.
It's a historic week for the Vaisala Xweather team for a few reasons:
We've just launched our new demo site on xweather.com. This new demo portal allows users to toggle between MapsGL (vector) and raster map layers to visualize global weather impacts with industry and use case-specific focuses.
California received its first-ever tropical storm watch today, with the currently-Category 4 Hurricane Hilary expected to make landfall as a tropical storm late Sunday night into the wee hours of Monday morning.
We're marrying these two events to showcase how to use these new demos and visualize the dangerous - yet visually stunning - situation off the coast of California in the process.
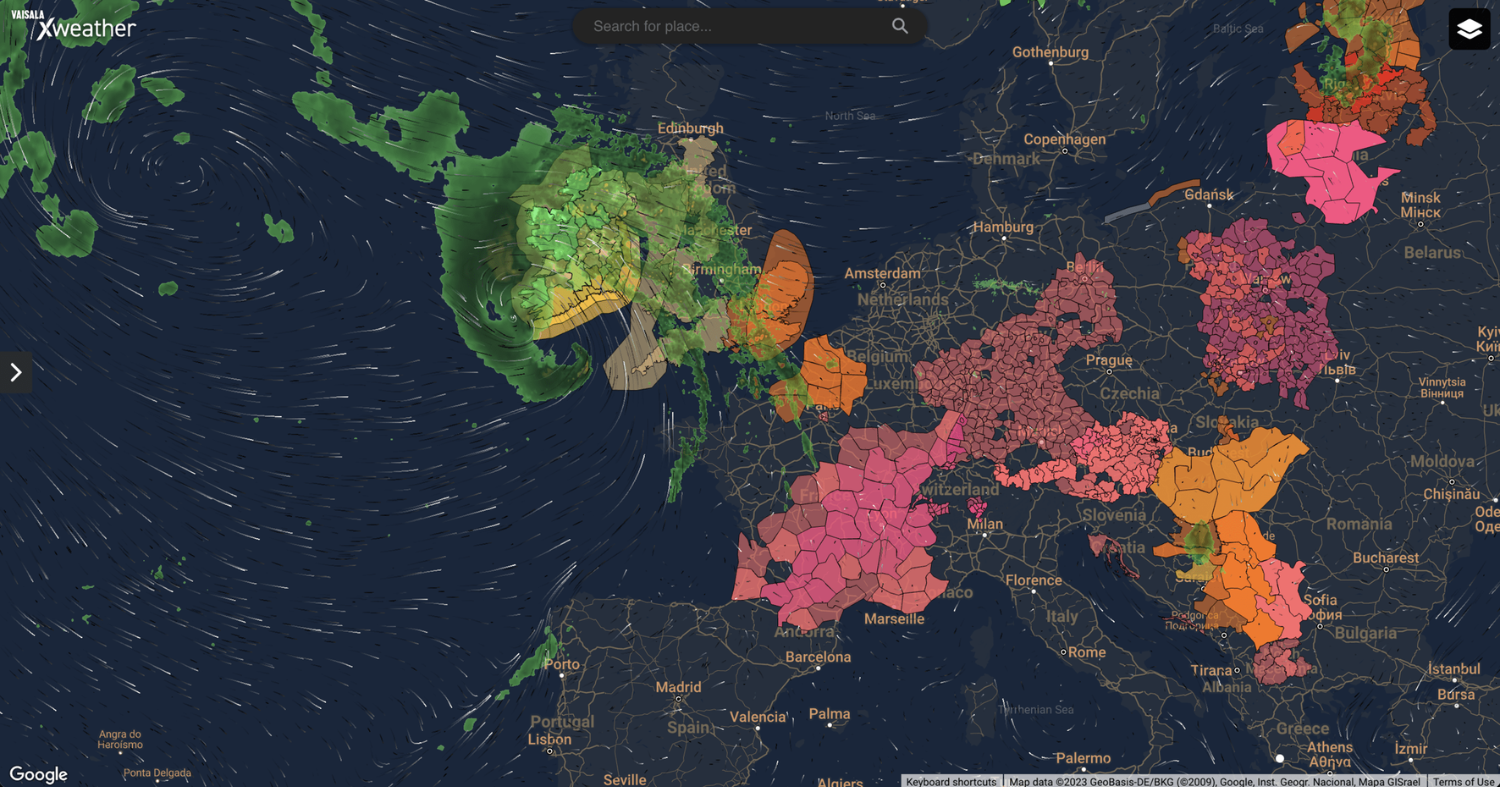
Demo view showcasing Google Maps, wind particles, alerts, and radar.
Using the demos
Navigate to demos.xweather.com. This should preload to a panned-out view of the United States, but you can view any location in the world by panning within the map or searching for a location using the search bar in the top middle of the demo interface.
The demo will also default to our Outdoor Rec/Severe preset - you can modify this using any of our existing industry presets. The left-hand menu contains those options, as well as the ability to select your preferences for the following:
Map theme, including light and dark modes
Mapping library (we currently provide support for Mapbox (default), MapLibre, Leaflet, and Google Maps)
Weather layers - MapsGL or raster
Note: Certain raster layers are accessible with the MapsGL preset.
The right-hand menu is where you get to select your layers. Different layers will be available based on your industry preset. Certain overlays - such as stadiums, schools, and parks in the Outdoor Rec/Severe demo and heating and cooling degree days for the Energy & Utility demo - are also available based on your selected industry.
For a full list of raster layers, click here. | For MapsGL layers, click here.
To activate the Generative AI functionality within any of the demo presets, just click any point on the map. This will open up a pop-up where the various AI outputs will display based on the layers you've selected.
One of the best features of this new demo site is that after you build your perfect view, everything you've included in your map has been built into your URL string - so you can share it with others just by copying the link in your browser and sending it to them.
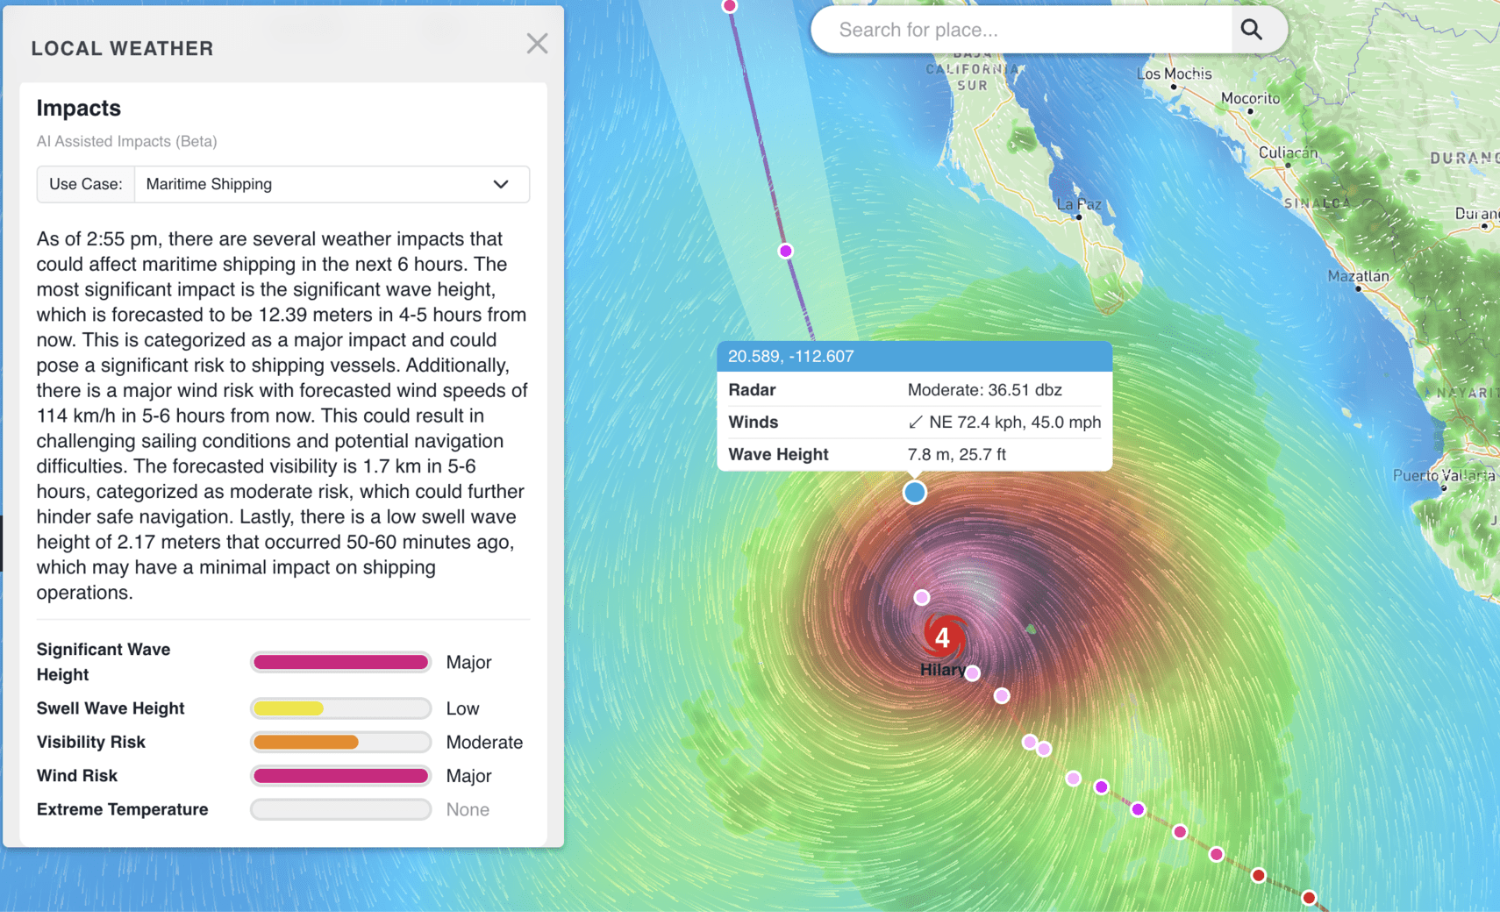
This capture uses the maritime/shipping demo preset. Pictured are Hurricane Hilary's position, forecast, precipitation, wind speeds and direction, and the impacts on maritime shipping along the hurricane's path, aided by Generative AI technology. Note: To use the AI, click around to check out different outputs and conditions at specific points on the map.
Creating an active tropical cyclones view
As we've already stated, one of the key benefits of these new demos is the sharability of maps that have been curated to display specific features. To test that out for yourself, you can click here to view the visuals we'd originally created for Hurricane Hilary, though she's long gone by now and you likely won't find another active tropical storm off the coast of California for a bit.
You can recreate the view yourself for any part of the globe with active tropical cyclones with the following steps:
Navigate to demos.xweather.com and pan/zoom to the area of interest
Select the Maritime preset from the industries options in the left-hand menu
The following layers will already be selected - keep these:
Wav Dir: Particles
Radar
In addition to those, select the following:
Cyclones --> Active Cyclones (under Tropical)
Winds (under Conditions)
You should now see a view similar to the one depicted in the screenshot towards the top of this article. To get Generative AI outputs, click into a few spots in and around the active cyclone.
Voila! Stunning imagery rich with data and insights. Other interesting layers to further contextualize or enhance your tropical storm visualization include:
Ports (at the very top of the menu)
Alerts and Lightning Strikes (under Severe)
Wave Heights (under Waves)
We're thrilled to continue bringing critical weather data to businesses around the world. These demos are meant to spark imagination and realize potential for weather-aware systems and protocol across the globe.
)