Xweather is EPSG:4326 compliant, so creating flexible maps using any compatible basemap and our weather mapping layers is simple.
GIS technologies have been revolutionizing the science of geospatial analysis since their inception. These powerful tools have rapidly advanced to aid in problem-solving. At Xweather, we use these technologies regularly to model and test our weather data and imagery and to capture, store, manipulate, analyze, manage, and present all types of geographical data in unison with our own. As with any software that gains mainstream adoption for personal, educational, and enterprise use, open-source alternatives have taken hold, with QGIS being one of the most widely adopted.
Our flexible layers make qualitative analysis or creating clean views of special projections a breeze, regardless of your basemap - so long as it conforms to popular geospatial guidelines.
Step 1: Adding a basemap (optional)
Notes:
This project requires an active Weather API account. Sign up for a free trial here.
Although basemap options are provided with Raster Maps, for this guide, we will assume a use case requiring a thematic map with weather overlays. Skip to section 2 if this does not apply.
Begin the process of adding a map layer to your project by opening QGIS. Most recent versions will have a similar interface, but it is recommended to use the latest edition for optimal stability and performance. You should land on an empty project file that you can load a base map into. One of the quickest ways to do this is via the QuickMapServices plugin.
How to install:
To do this, visit the Plugins Menu at the top of QGIS
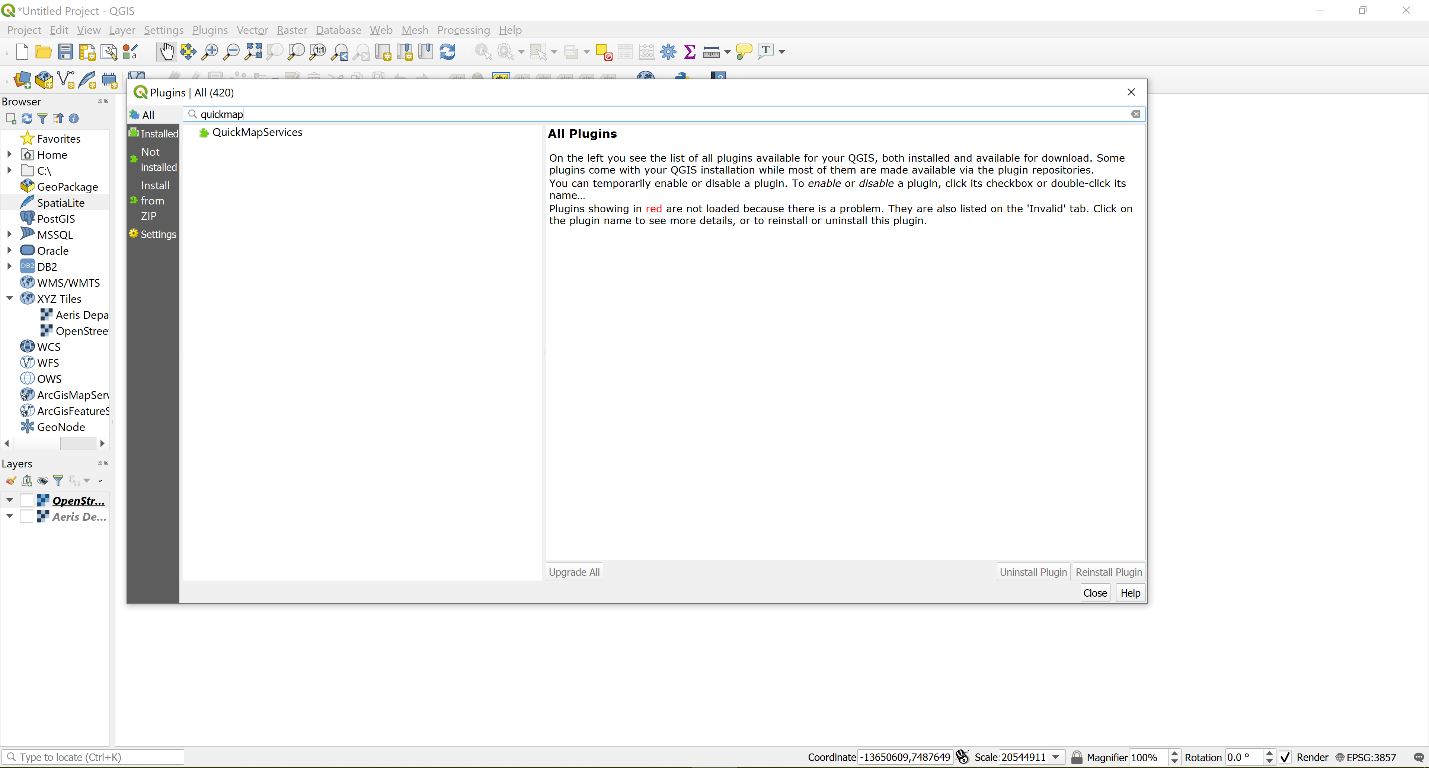
QuickMapServices is easily searchable in the QGIS Plugin Manager.
Visit “Manage and Install Plugins…”, and in the top search bar, begin to enter “QuickMapServices” and click “Install” once you’ve highlighted the plugin.
From here, you should be able to find QuickMapServices in the web toolbar. The icon appears as follows:
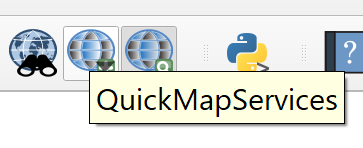
After clicking on the QuickMapServices icon, select "More services in the top tabbed bar, then click "Get contributor pack". This will add the full list of QGIS-extensible basemaps provided by the QuickMapServices plugin to the dropdown for the QuickMapServices icon. Selecting one of these base maps will automatically place it into your QGIS project file.
Step 2: Add Xweather Map tiles
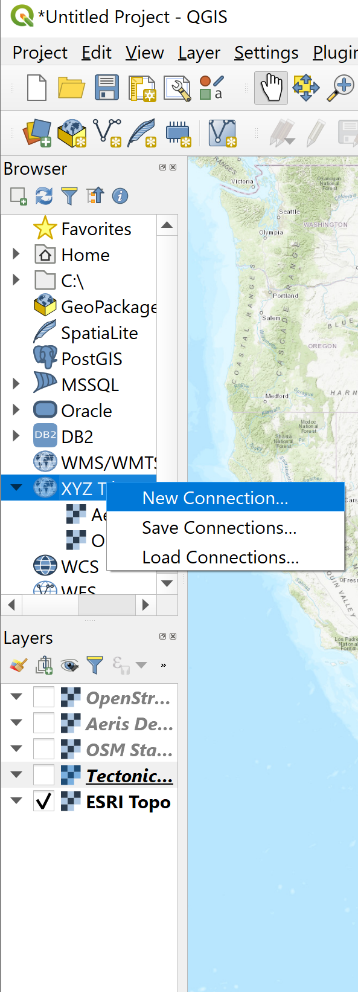
Once you have signed up for a Weather API account (free trial here), place the URL for your requested tiles into “XYZ Tiles” by right-clicking in the left “Browser” pane; then select “New Connection…”:
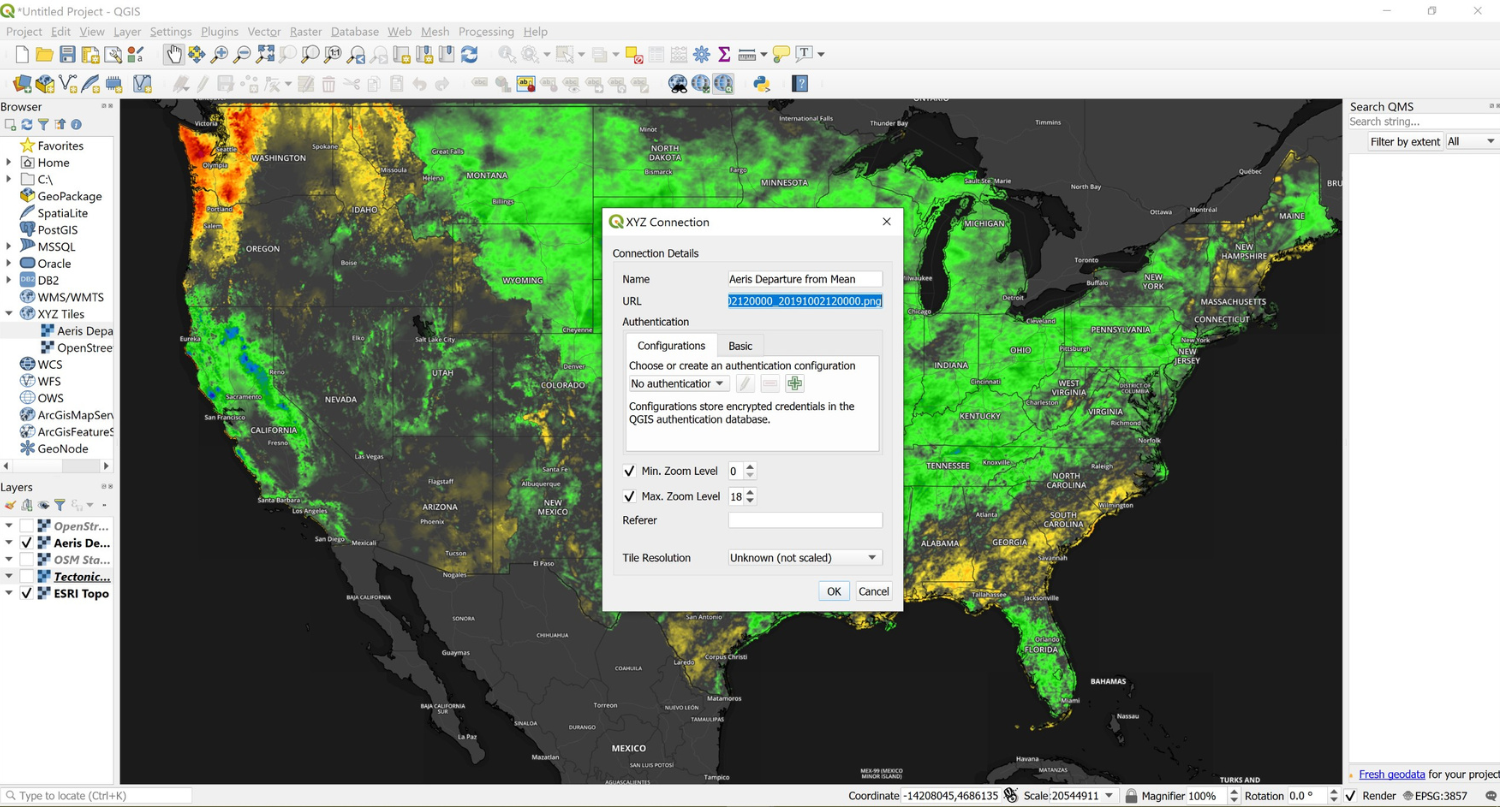
Place your map tile URL in the “URL” field and provide a name for the layer. You can find this URL at the bottom of the Xweather Map Builder in your account dashboard:
Once you confirm the URL and apply it to your map, you can begin transforming the layer to fit your needs. An example URL appears as follows:
https://maps.aerisapi.com/ClientID_ClientSecret/flat-dk,water-depth,radar,admin-cities-dk/{z}/{x}/{y}/current.png
Below is an example of the Xweather “Departure from Mean Precipitation” layer at 100% transparency and the URL input field necessary to load the layer in:
Step 3: Manipulate your layers
Incorporating a thematic base map from a source like the USGS or ESRI can turn Xweather Maps layers into powerful visual storytelling tools.
Example 1:
Laying departure from mean precipitation over the ESRI topographic basemap highlights historical weather trends (in this case, precipitation) across varying topography:
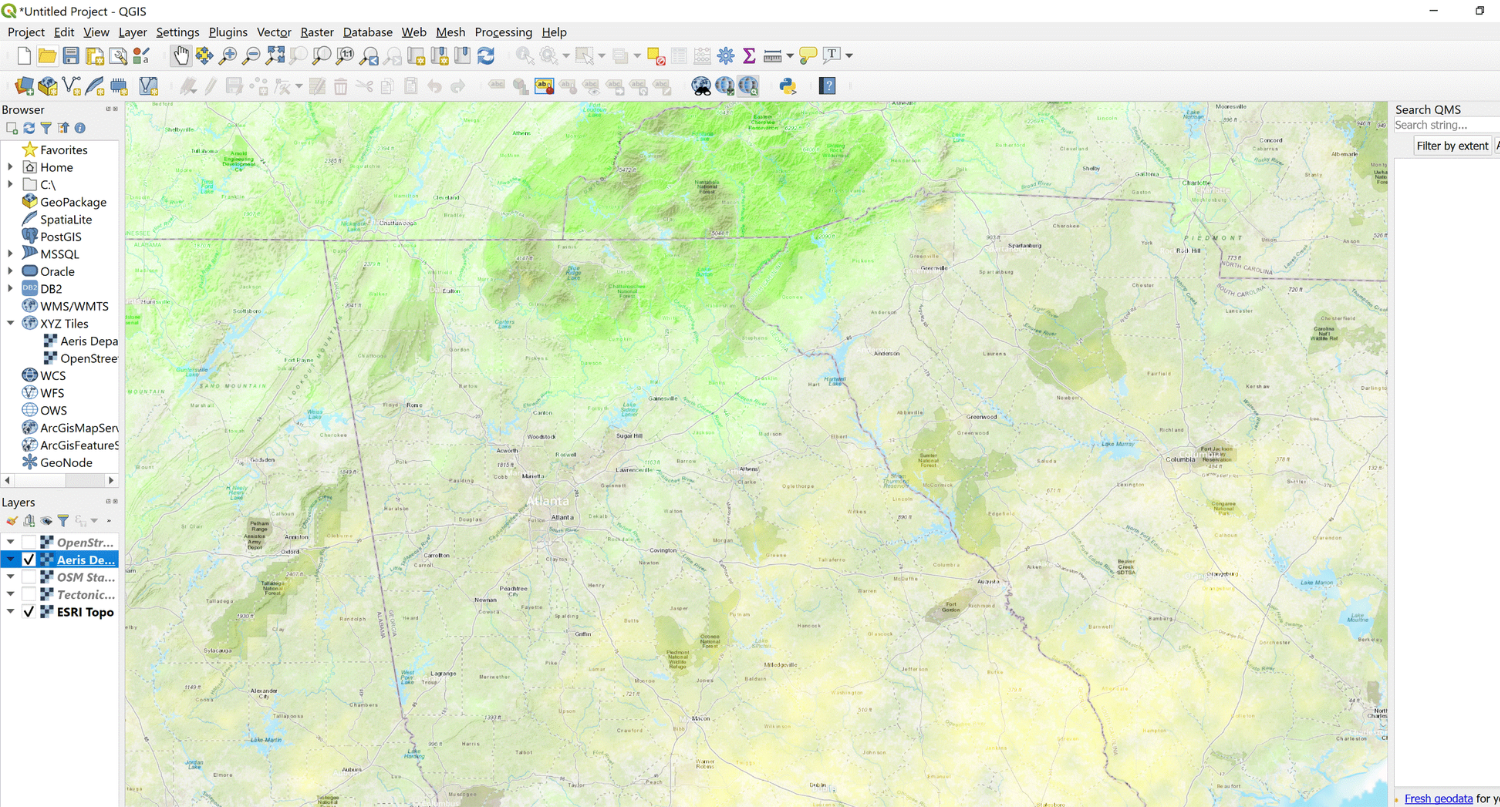
Visual warning of drought conditions in agrarian south Georgia
Flood and mudslide risk in mountainous north Georgia
Right-click the desired weather map layer and select “Properties” for several options to visually alter the weather map layers display. Select “Overlay” in the Symbology tab for Color Rendering to produce a map similar to the following:
Example 2:
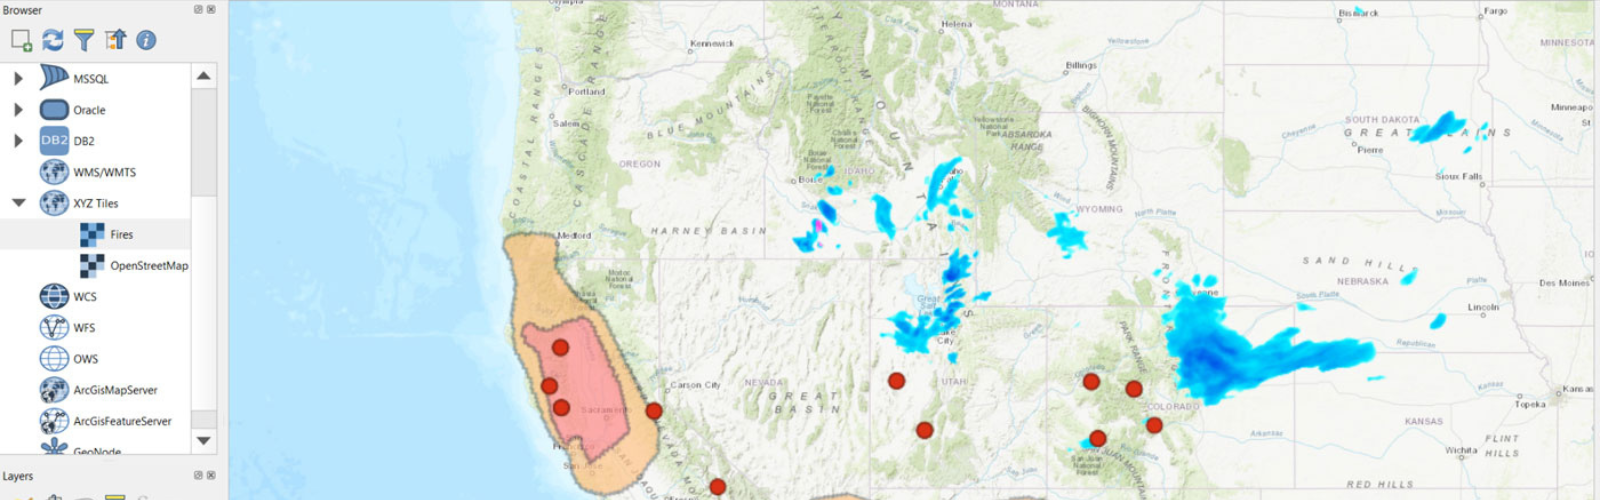
One can model with great accuracy the impact of the rain shadow effect and how the leeward side of the San Juan Mountains of southwestern Colorado might be exacerbated by changes in jet stream position or prevailing wind speed and direction.
As one can see, the result is a highly readable and impactful visual. Aside from government and agricultural use cases for weather mapping tiles, applications for weather map layers in your QGIS instance are limitless and can be used to streamline decision-making across industries. Choose from our extensive list of map layers to create the views most beneficial to your needs, from tropical radar and storm paths to lightning strikes and forecast snow accumulation.
Using a quantitative approach in QGIS? Explore our robust weather API to query historical, current, and forecast weather datapoints with ease. With JSON and GeoJSON outputs, the API can post relevant data directly into your geospatial database.
)