)
)
In another post, we discuss how to query the Xweather hurricane endpoint, accessible via the Xweather API through Weather API and Maps subscriptions. While real-time tropical cyclone data is easy to use, visualizations of that data help tell the story and further minimize storm risks.
This tutorial will walk you through the mapping counterpart to the tropicalcyclones endpoint, also accessible through Weather API and Maps subscriptions. These tropical layers allow you to create a variety of hurricane and typhoon-centric weather maps within your own apps and projects.
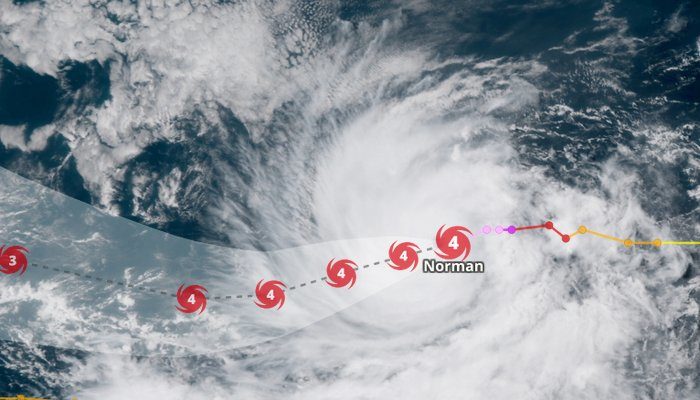
Tropical-cyclones layer overlaid on the satellite-geocolor layer
The primary layer: tropical-cyclones
The tropical-cyclones layer is our most commonly-accessed tropical layer, displaying all active cyclones across the globe — including the Atlantic, East Pacific (West Coast of North America), Central Pacific (Hawaii region), West Pacific, the Indian Ocean, and the Southern Pacific/Hemisphere (Australia region).
The tropical-cyclones layer combines the following tropical cyclones components into a single layer using the z-index order from bottom to top:
Forecast error cone
Forecast line
Forecast point icons
Previous track line segments
Previous track points (circles)
Current position icon
Just use the layer code tropical-cyclones to add this combined layer to your map.
Static tropical map example
The following request will display a tropical map that includes both the history and forecast tracks for Super Typhoon Jebi in the West Pacific:
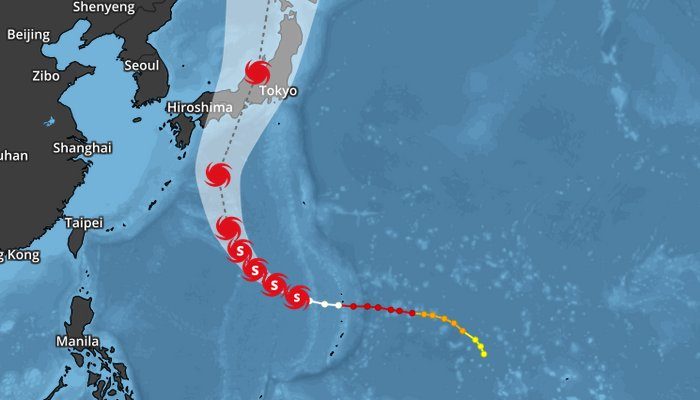
Visual of Super Typhoon Jebi, created using the tropical-cyclones layer
Combining the tropical-cyclones layer with our variety of satellite options is invaluable in demonstrating the full magnitude and size of a tropical cyclone:
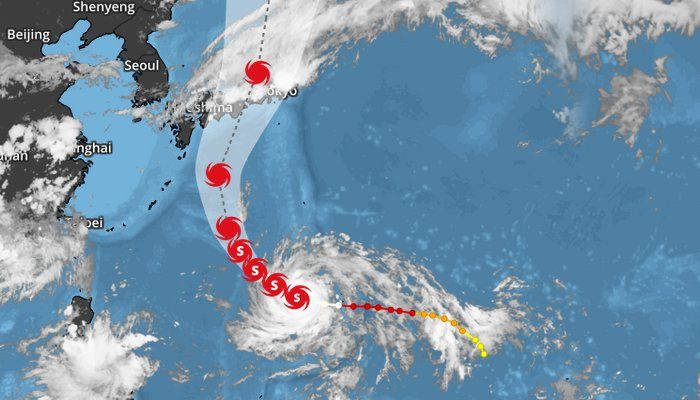
tropical-cyclones layer overlaid onto the satellite layer
Leaflet example
The tropical-cyclones layer can also be used with third-party mapping libraries such as Leaflet. Combined with the Xweather API's tropicalcyclones endpoint, you can achieve a fully interactive tropical map.
Custom layer combinations
While the tropical-cyclones layer includes the most commonly used components in a single layer, Xweather Raster Maps allows users to combine the individual tropical layers in unique combinations. You just need to use a combination of one or more of the available new tropical layers.
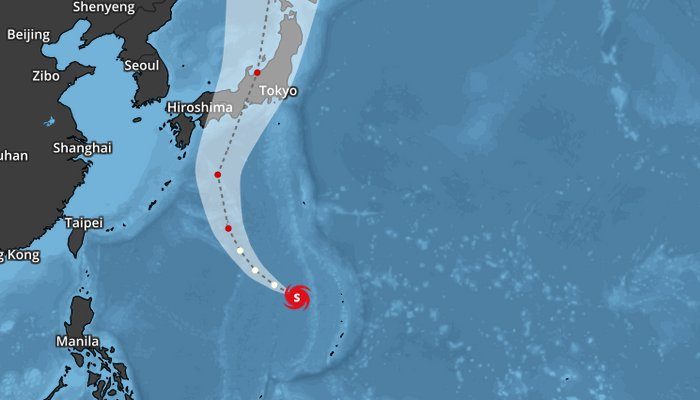
For example, you may only want to display the current position and forecast, but not the previous track. You could use the combination of:
tropical-cyclones-forecast-error-cones
tropical-cyclones-forecasts-lines
tropical-cyclones-forecasts-points
tropical-cyclones-position-icons
Example using a combination of several forecast layers and current position icons
If you want to replace the forecast points with system icons, you can replace the tropical-cyclones-forecast-points layer with tropical-cyclones-forecast-point-icons:
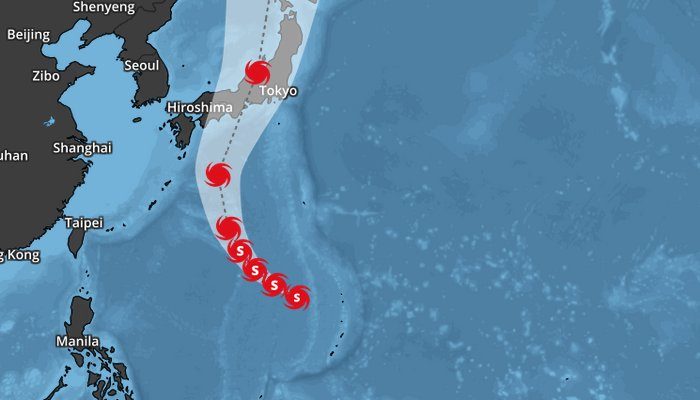
Secondary example using a combination of several forecast layers, current position icons, and the tropical-cyclones-names layer.
Finally, let's add the cyclone names with the tropical-cyclones-names layer:
Use the Map Builder
Test out all of our tropical layers with the Map Builder in your account dashboard.
Whether you're using the default tropical cyclones layer or combining individual layers for a fully custom tropical map, our new tropical layers are built with the flexibility to ensure you get the visualization you need. Tropical layers are available to all Weather API and Maps users, but you can also test-drive them with a free trial.
)