The Xweather JavaScript SDK has a plethora of features. The Interactive Map App allows you to plot weather data on an interactive map easily and comes with several built-in modules that simplify weather data plotting. The Tropical module provides users with predefined styling and functionality for plotting various tropical cyclone data layers. While these default styles may suffice for most users, we want to dive deeper and show you how to add your own custom styles to the Tropical module.
The Tropical module consists of several modules as part of a module group. To reduce the file size of your SDK application, these modules can be lazy-loaded. This is where we will override the default styles with our own custom ones. Note that we provide a reference to the built-in utility functions in the Tropical module. These helper functions will make our custom styling life easier.
Styling the tropical systems
Overriding the default styling is quite simple. All you have to do is provide your own style config object when loading a certain module. In the example below, we are lazy-loading the Tropical module and then providing said style config object.
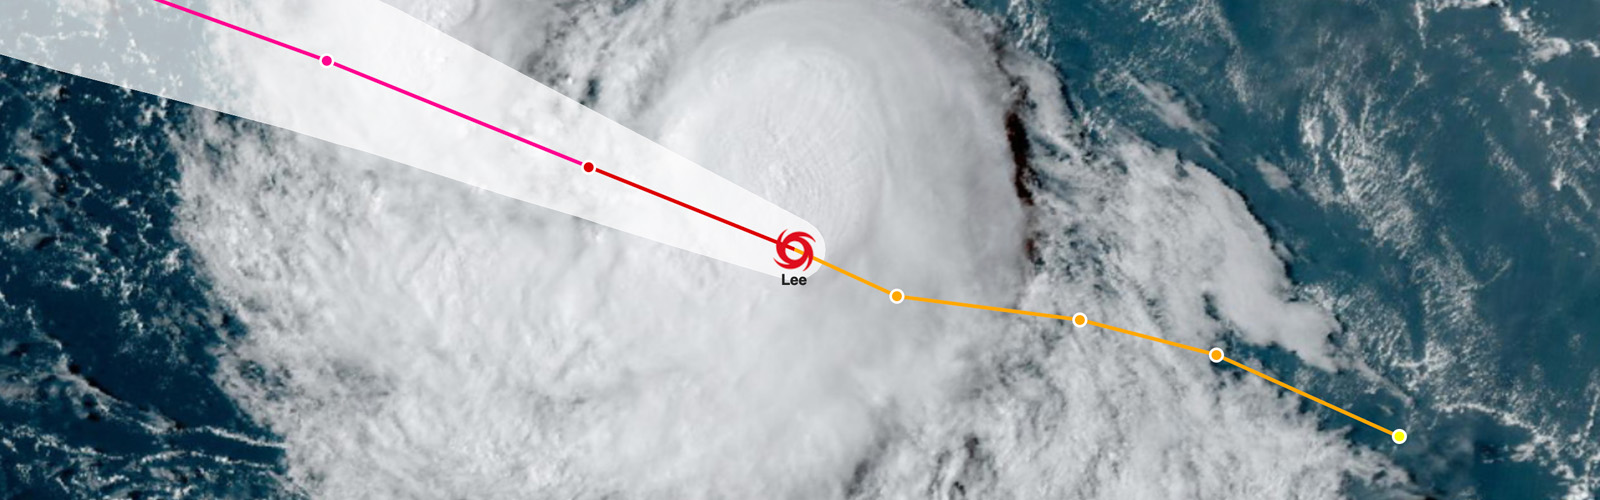
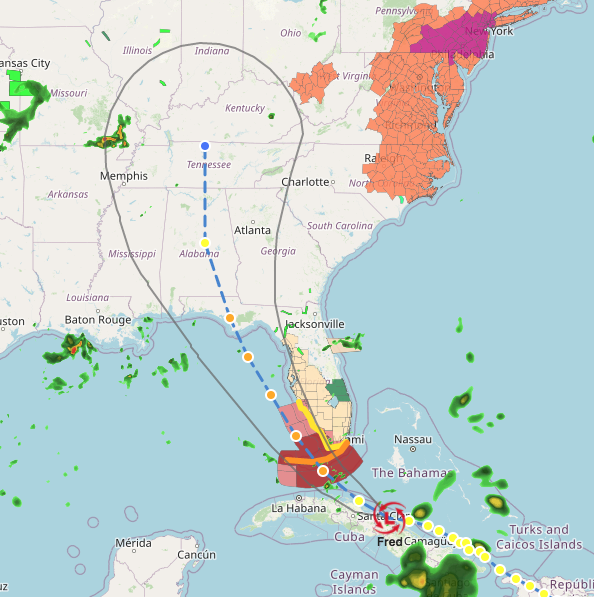
This will implement the custom styles to plot a tropical cyclone similar to the following image:
That was easy. Now let’s take our customization further by adding date labels and storm icons along the forecast track. We will need to create a utility function that determines the icon and date labels and then pass that into our custom style config as the marker.
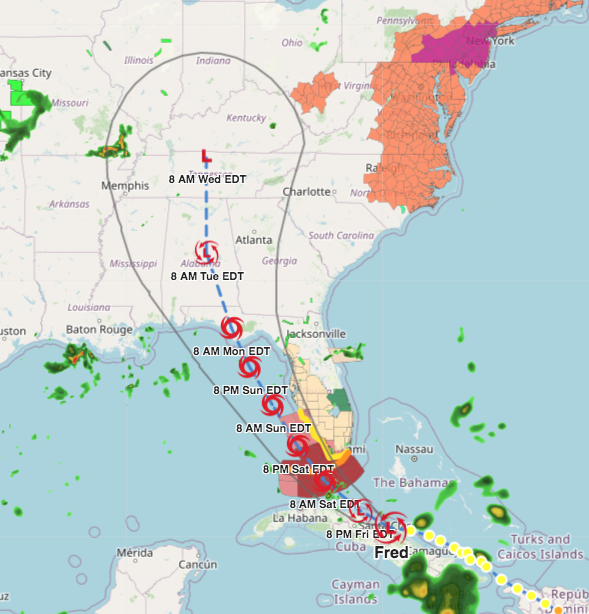
This will result in our image now including icons (based on the forecast intensity) and date labels at each forecast point instead of a circle.
The getStormMarkerConfig function used to customize the forecast point icons and labels can be found in the full example below.
Custom tropical cyclone styling is just the tip of the iceberg - or, in this case, the hurricane icon. You can take this example and your hurricane tracking even further with numerous other features included in the Javascript SDK and Interactive Map App. Sign up for a free trial and get started today. Happy coding!
)