)
)
At the time of publishing, we're just a few weeks from the peak of tropical cyclone season. As tropical storms and hurricanes form, our JavaScript SDK’s tropical module allows you to display their track, latest position, and forecast. Our severe weather demo showcases many of the tropical module’s capabilities, but this tutorial will walk you through how to create your own visuals using our raster map offering.
Setting Up
Though MapsGL does not currently have tropical layers, you can still display raster tropical layers on a MapsGL map using this same process.
During tropical cyclone season, there are often multiple active systems that may have overlapping tracks and five-day forecasts. Displaying tropical cyclones on a map can highlight overlapping storm paths, causing the visualization to lose clarity. To improve this, we will walk through adding the option to allow users to select one storm at a time via the layers panel. You can view a working CodePen example here.
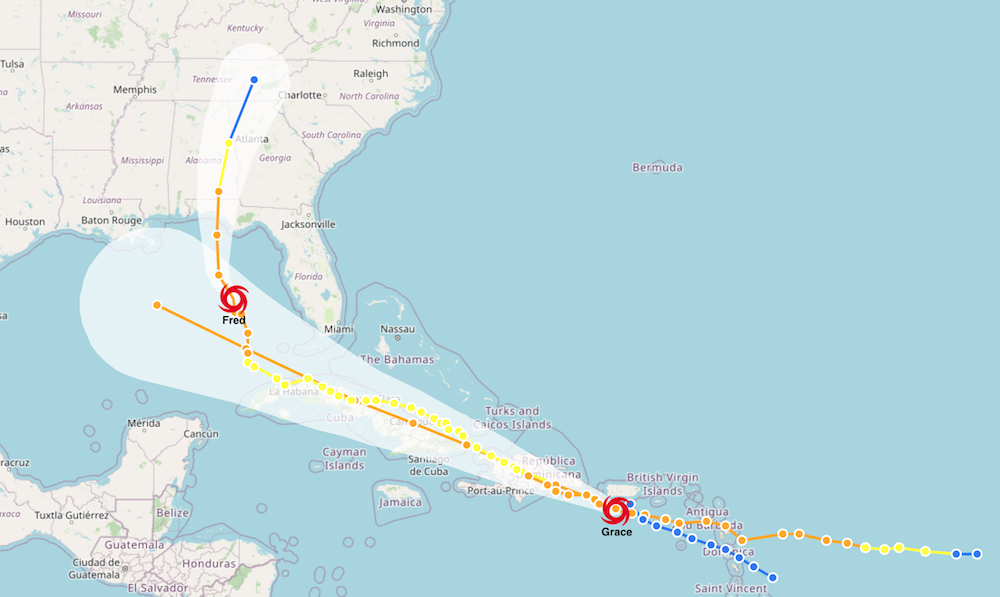
Example of Tropical Storm Fred and Tropical Storm Grace crossing paths (2021)
Fetching the Active Systems
The first step is to fetch the active systems from the Weather API via the tropical cyclones endpoint:
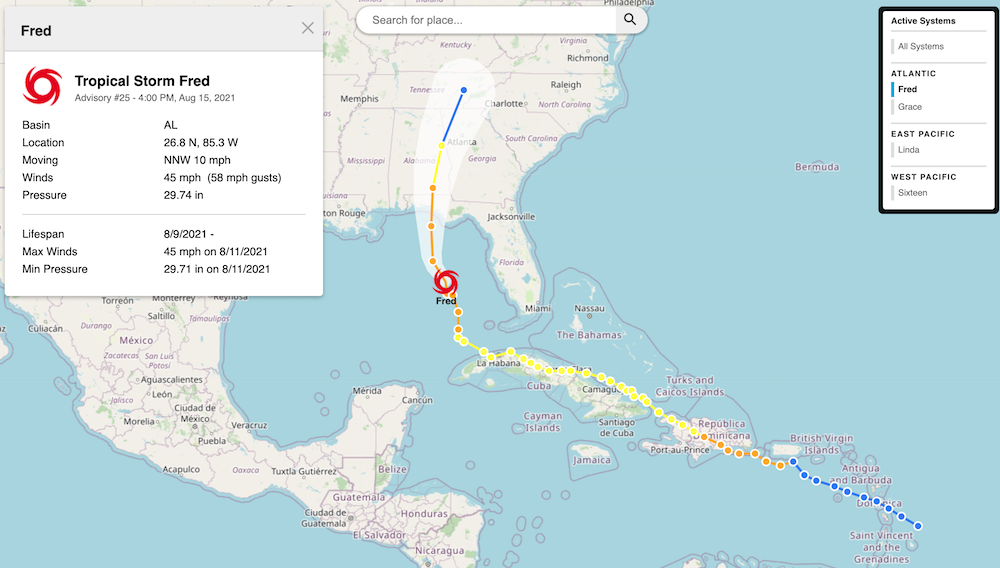
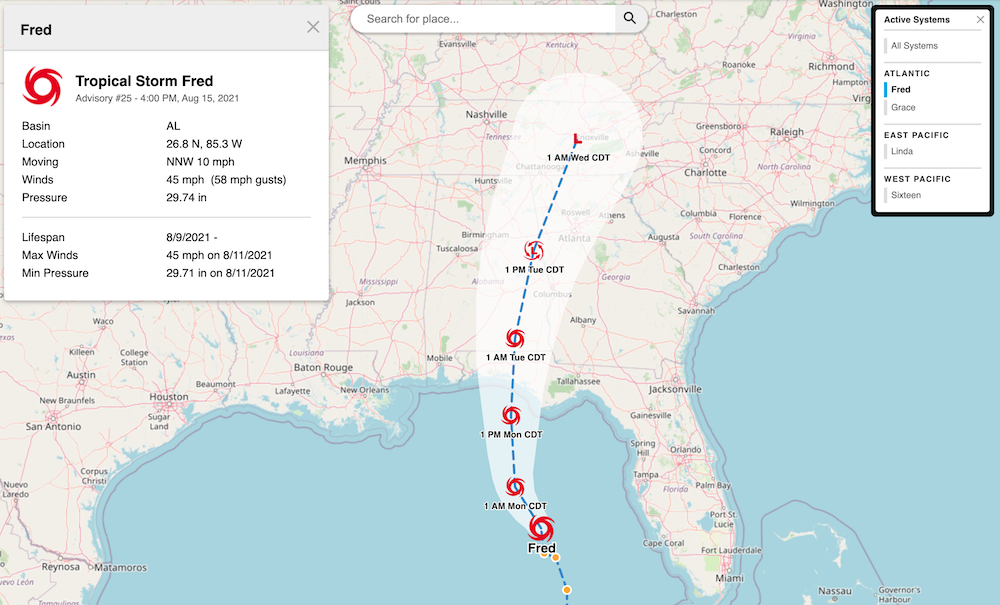
Example of an individual tropical cyclone (Tropical Storm Fred, 2021)
Defining the Basins and Order
Next, let’s define the order and associated names of the basins to separate the active systems into:
Adding the Systems to the Layers Panel
Once the interactive map has loaded, we need to fetch the active systems and display them within the layers panel:
Once loaded, if there are active systems, the layers panel will look similar to:
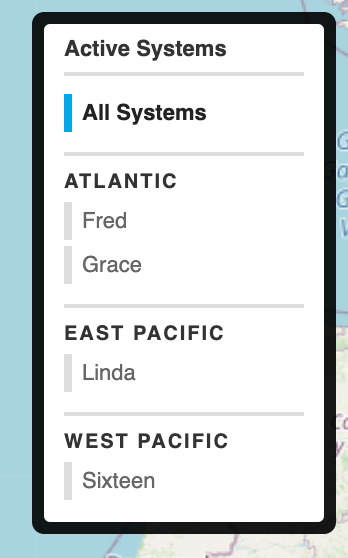
Example of layer panel with individual tropical cyclones
Selecting an Individual System
Next, we'll add an event to capture a user selecting an individual tropical system and trigger the map to refresh and zoom in on the selected typical system:
The Complete Example
Below is the complete example code. Remember to replace CLIENT_ID and CLIENT_KEY YOUR ID and key!
Custom Styling for Individual Systems
For a tutorial on customizing the styling of a tropical cyclone on your map, visit this article. As seen in our working CodePen example, some customization options are using icons for a system's forecast path or displaying date and time labels with the forecast.
Tropical Storm Fred (2021) with custom styling
Next Steps
With Javascript SDK you have plenty of options to integrate and customize tropical cyclones with your platforms. Sign up for a free developer account and get started today. Happy coding!
)