95%
accuracy for hour-ahead energy forecasts
92%
accuracy for day-ahead energy forecasts
Sub-hourly
and hourly and daily power forecasts up to 230 hours ahead
Wind and solar energy forecasting
Accurate energy forecasts are essential for effectively managing wind and solar assets and investments, reducing risk, and gaining a competitive edge in energy markets.
Vaisala Xweather combines cutting-edge modeling, robust data science, and high-speed supercomputing to produce accurate energy forecasts up to 230 hours ahead. We deliver high-quality, site-specific forecasts for solar and wind farms worldwide.
Parameters
Project average power (MWh)
Potential power
Key weather parameters
Icing alerts
Deliverables
Sub-hourly, hourly, & daily forecasts
Historical forecasts for evaluation
Xweather renewable energy portal
Situational awareness tool
API support
Reduce the risk of volatility
Unexpected weather exposes your operations, investments, and trading strategies to unwanted risk. A more accurate energy forecast lets you plan, invest, and trade with confidence. Xweather delivers:
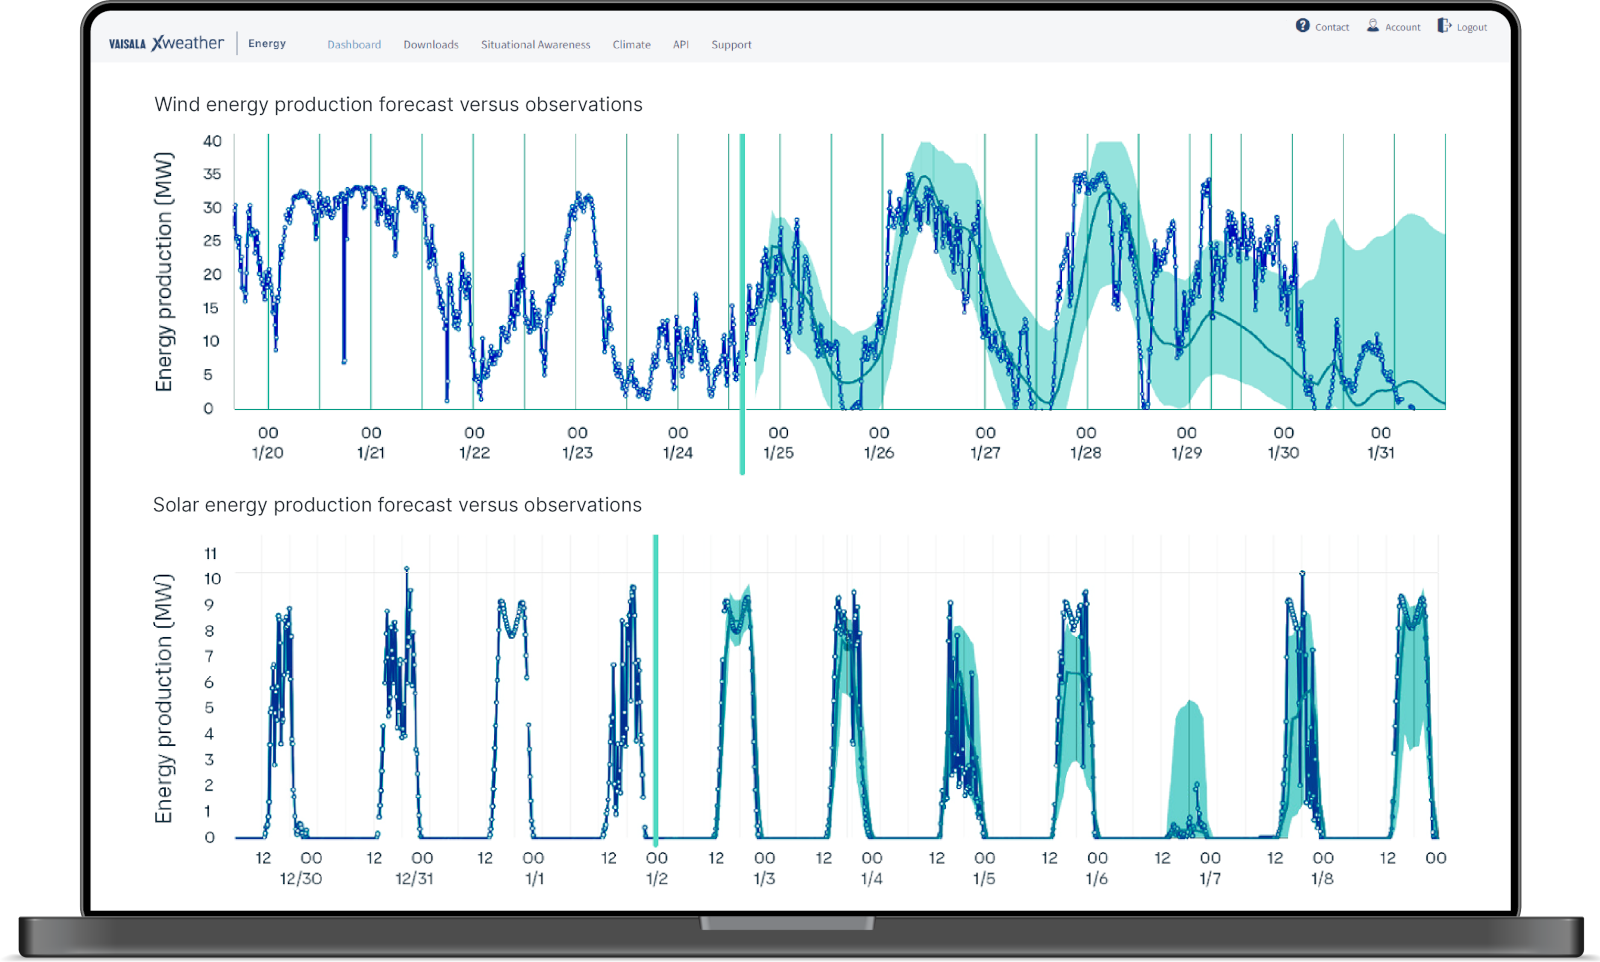
Sub-hourly, hourly, and daily power forecasts up to 230 hours ahead, updated every 5 minutes.
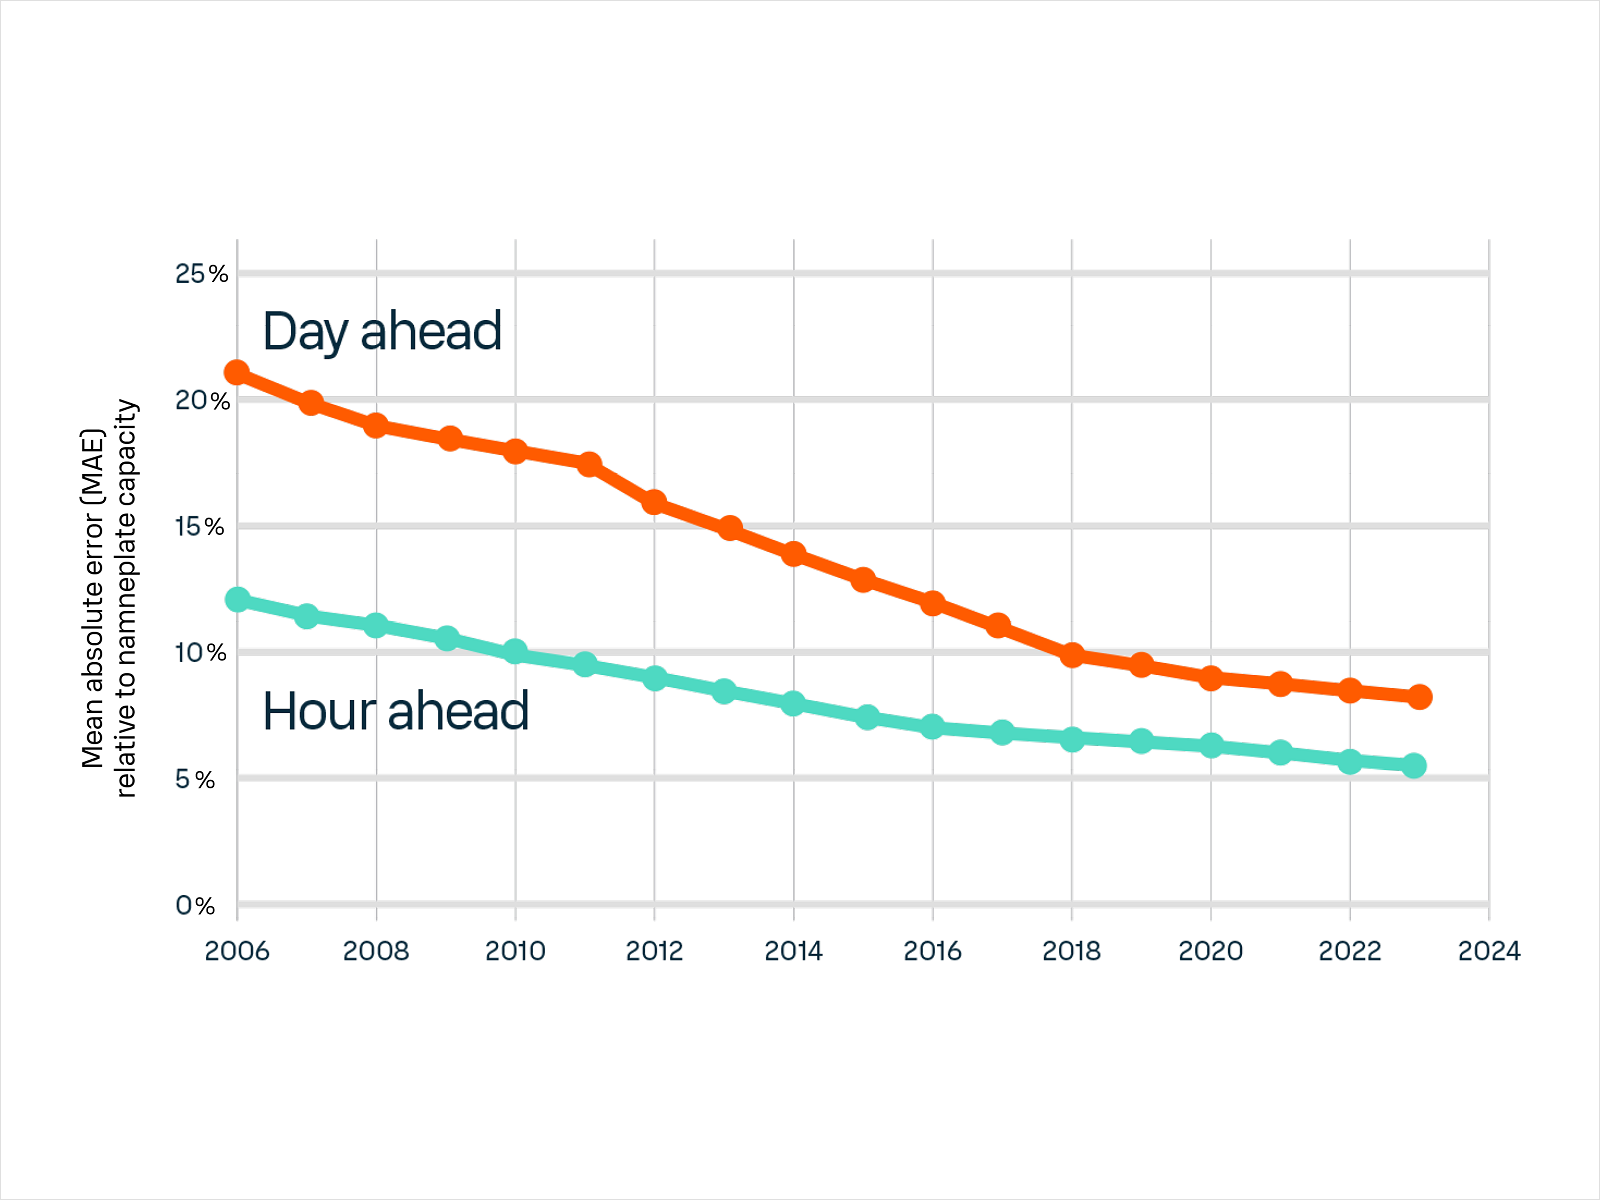
A mean absolute error as low as ±5% for hour-ahead forecasts and ±8% for day-ahead forecasts relative to nameplate capacity.
Calibrated prediction intervals for every forecast.
Energy forecasts up to 30% more accurate than those obtained from ECMWF alone.
Site-specific forecasts worldwide.


Continuous investment in improving accuracy
Our team brings over 20 years of solar and wind industry experience and investment in weather data, science-based modeling, and forecasting innovation. Our forecasting solution combines cutting-edge modeling, robust data science, and highly trained, advanced machine-learning algorithms focused on bias correction.
Our latest innovation in cloud nowcasting significantly improves the accuracy of short-term solar irradiance forecasts. Using this technique, we've achieved a 20% reduction in mean absolute error in solar energy forecasts compared with a skillful baseline that uses machine learning, site power observations, and ECMWF and HRRR forecast models.
Improve your situational awareness
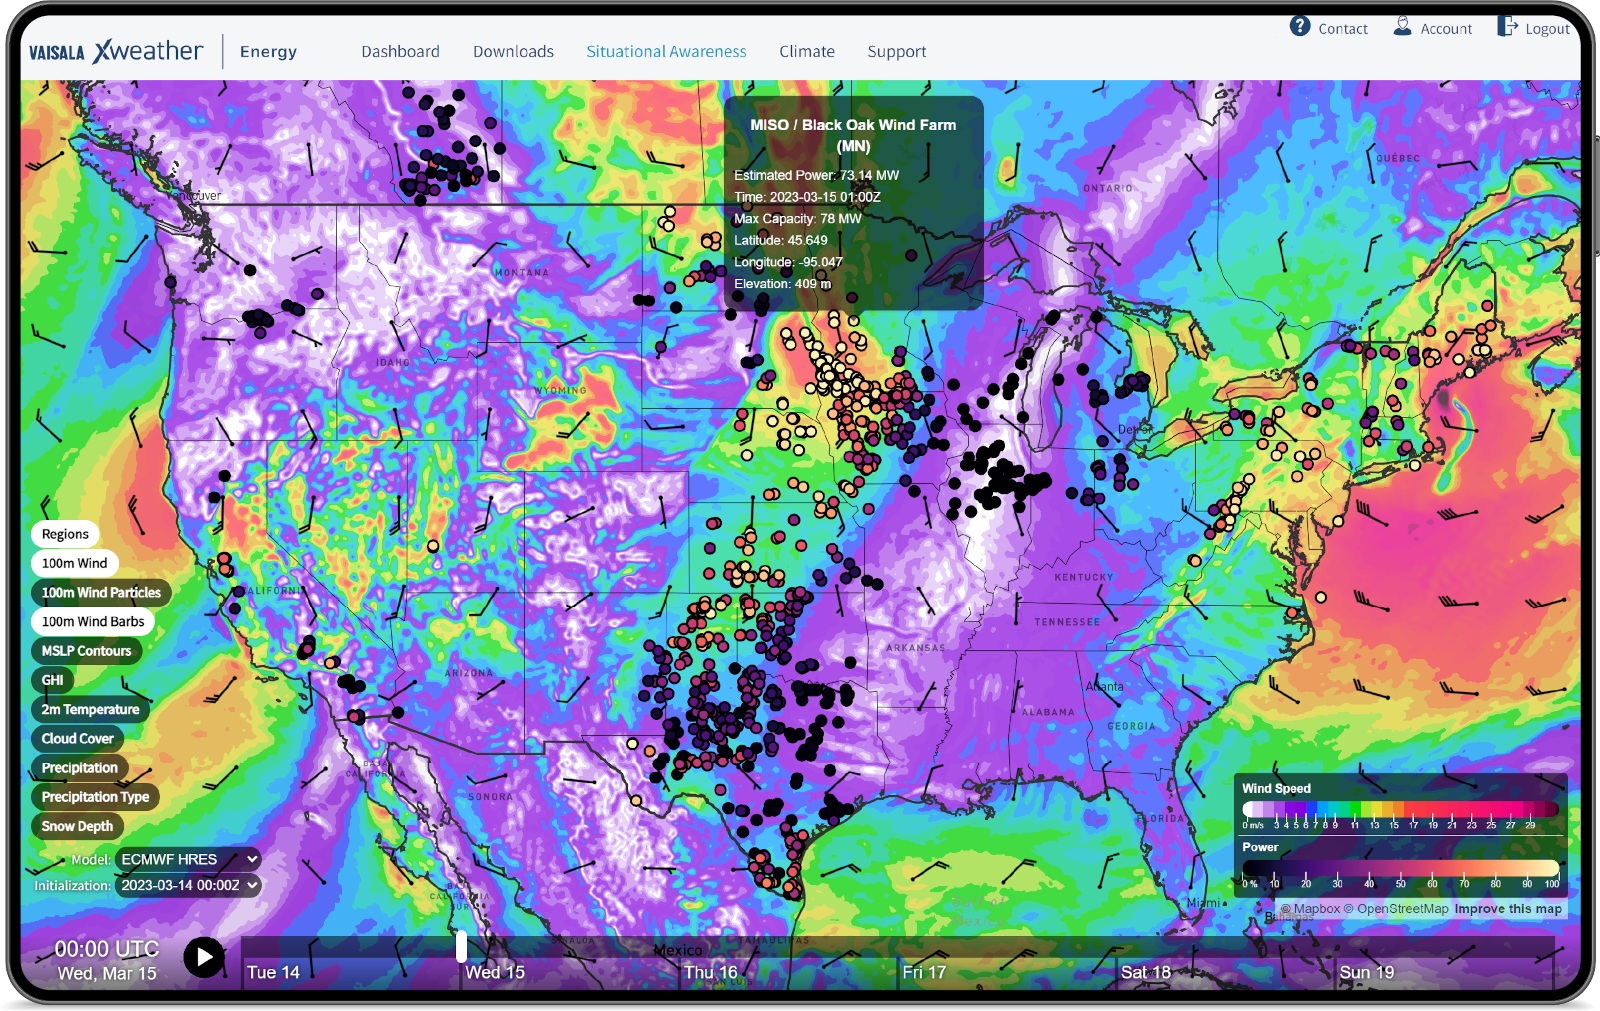
The Xweather situational awareness tool forecasts the key weather parameters for renewable energy globally and provides an intuitive, map-based visualization of renewable energy production across the major electricity trading markets in the United States and parts of Canada.
Energy forecasting
Circles on the map mark the location of energy projects. The color indicates the project’s estimated energy output as a percentage of its nameplate capacity. Here we see a wind farm operating at close to capacity.
Weather forecasting
Map layers include wind speed and direction at hub height 100 meters above ground level, global horizontal irradiance (GHI) at ground level, cloud cover, atmospheric pressure, precipitation rate and type, snow depth, and air temperature at 2 m.
Timeline
Look ahead with an animated six-day forecast or review forecasts from up to 60 hours in the past.
Compare plans
| Basic | Standard | Premium | |
|---|---|---|---|
Forecasts | |||
| Hourly average power (MWh) | |||
| Wind speed, wind direction, wind gusts | |||
| Solar resource parameters: GHI, DIF, DNI | |||
| Air temp., air pressure, precipitation, humidity | |||
| Historical forecasts for accuracy evaluation | |||
| Icing alerts | |||
| Potential power | |||
| Forecast time step | hourly | hourly | every 5 minutes |
| Update interval | every 6 hours | hourly | every 5 minutes |
| Forecast horizon | D0+7 days | D0+10 days | D0+10 days |
Models and inputs | |||
| NWP models : ECMWF (global) and HRRR (US) | |||
| Ensemble of ECMWF-EPS, GFS, UK Met, NAM | |||
| WRF-based modeling | |||
| Satellite-based cloud nowcasting | |||
Delivery | |||
| Vaisala Xweather renewable energy portal | |||
| Situational awareness tool | |||
| API support | |||
| Onboarding, data ingest, and FTP/API support | |||
| Custom formats and delivery modes | |||
| Forecast quality verification dashboard | |||
| Business intelligence dashboard | |||
| Custom reports | |||
| Dedicated account manager | |||
1 Standard and Premium plans require data from the site.
2 Sub-hourly forecasts require a real-time data feed from the site.
Get started with a 30-day free trial
Evaluate the accuracy of our site-specific wind and solar energy forecasts with a 30-day free trial at one location of your choice.
Step 1
Fill in the form with your details to request a trial.
Step 2
To set up your trial, we'll need the location of your wind or solar farm and 1–2 years of historical observation data from the site.
Step 3
After training our forecasting model, your trial begins with enhanced energy forecasts for your site from day one.