Among users of Xweather raster mapping, observation layers — especially surface temperatures — are the most frequently used. Historically, these layers have been limited to the United States and neighboring regions, which means they aren't useful for users in other parts of the world. We've been working on improving our observation layers over the past several months, and today we are announcing that our weather observation map layers are now available globally!
Map out observed weather across the globe
We have expanded our default weather observation map layers to global coverage, which update hourly. You won't need to change your code since the update applies to the default layer names you're already been using.
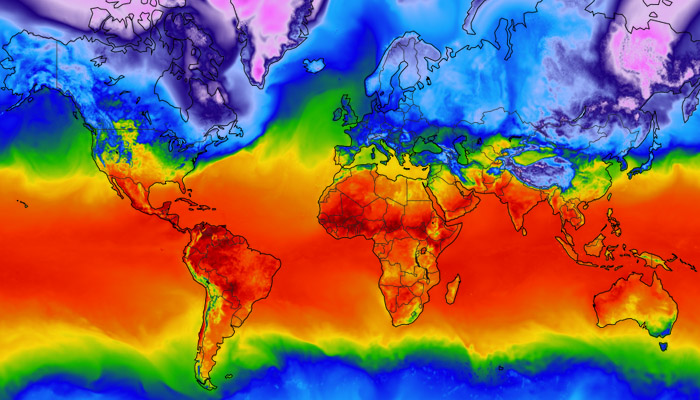
Here's an example showing global temperatures:

Global temperature map
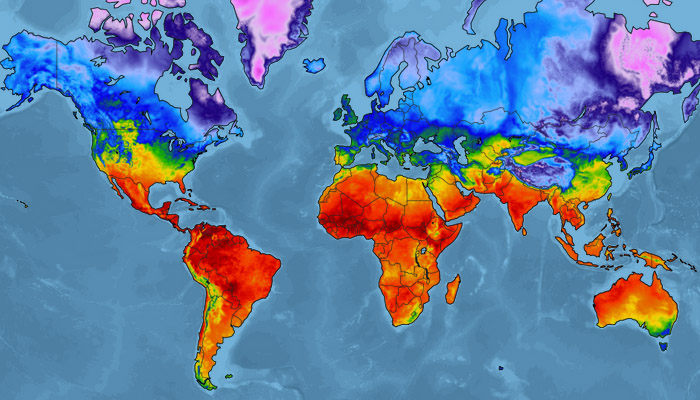
The same global temperature map with an ocean mask to show land surface temperatures:

Global temperature map with ocean mask
The following weather observation layers offer global coverage:
| Layer name | Description |
|---|---|
| temperatures | Global temperatures |
| heat-index | Global heat index |
| wind-chill | Global wind chills |
| feels-like | Global feels like/apparent temps |
| dew-points | Global dewpoints |
| humidity | Global relative humidity |
| wind-speeds | Global wind speeds |
| wind-gusts | Global wind gusts |
Improved global temperature data
One challenge when creating a global temperature map is the available data resolution. Even with over 50,000 observation stations reporting around the globe, observation data is still not available for large regions. Additionally, localized changes in temperature due to elevation changes, vegetation, and other factors can vary greatly over a short distance. So your closest observation station may be reporting temperatures considerably higher or lower than your locale due to effects of localized climate.
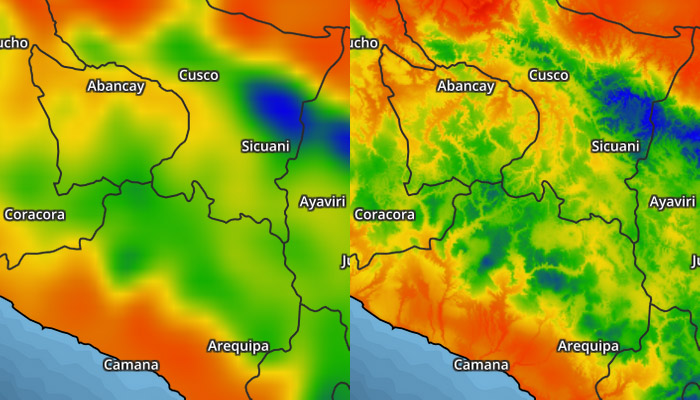
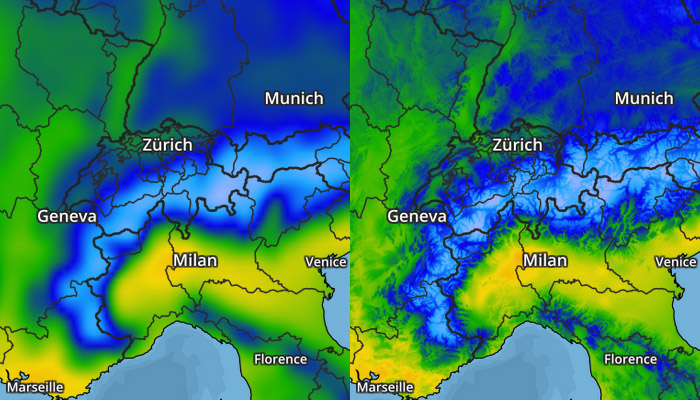
To improve the accuracy of our data, specifically observed surface temperatures, our teams have implemented a variety of techniques, including downsampling and bias corrections based on elevation models and other factors. As a result, we are able to generate weather layers that provide much higher resolution and more accurate detail that is better aligned with the true surface conditions.
Comparisons of surface temperatures without bias corrections (left) and with bias corrections (right) are exemplified below:


Currently, our team is applying bias corrections to all temperature-related observation layers, including feels like temperatures, dew point, and humidity, and will continue to be improved and expanded going forward.
Build your global temperature maps today
You can start using our global weather observation layers now with no changes needed for existing code. Furthermore, these layers are available to all Xweather Flex subscribers, including our free trial accounts.
