RoadAI onboarding guide
Everything you need to become a RoadAI expert!
Module 1: Heatmaps
Heatmaps allow you to visualize your road network with a color gradient. This color scale is applied to the PCI data calculated from your recorded routes. With a bird's eye view, it is easy to see where your best and worst roads are.
Watch the video below while following along in your own account.
If you would like to review more after the video, reference our Viewing Heatmaps support page.
Test your knowledge!
In your Map Interface, can you...
1. Find where your worst rated roads are?
2. Find where to click to bring up the video of a road?
3. Use the "Edit heatmap" pen button to only show roads with a PCI score 50% and less?

Module 2: Report creation
RoadAI allows you to export reports your recorded road data in either Excel, CSV, GeoJSON, or Shapefile format. These files can be viewed on their own or uploaded into a different Asset Management System.
Before you create a report, you may need to narrow down the data you want to export with our Filters and Polygon tools. Watch all three videos in order, while following along in your own account.

Filters
The Time Filters allows you to filter out data dependent on date and time recorded. The Road Network Filters allow you to narrow in on certain sections of your road network dependent on what is built into your road network geometry shapefile.
Polygon tool
The Polygon tool allows you to draw a shape around the area or areas of your network you would like to narrow your data down to before exporting.
Exporting reports
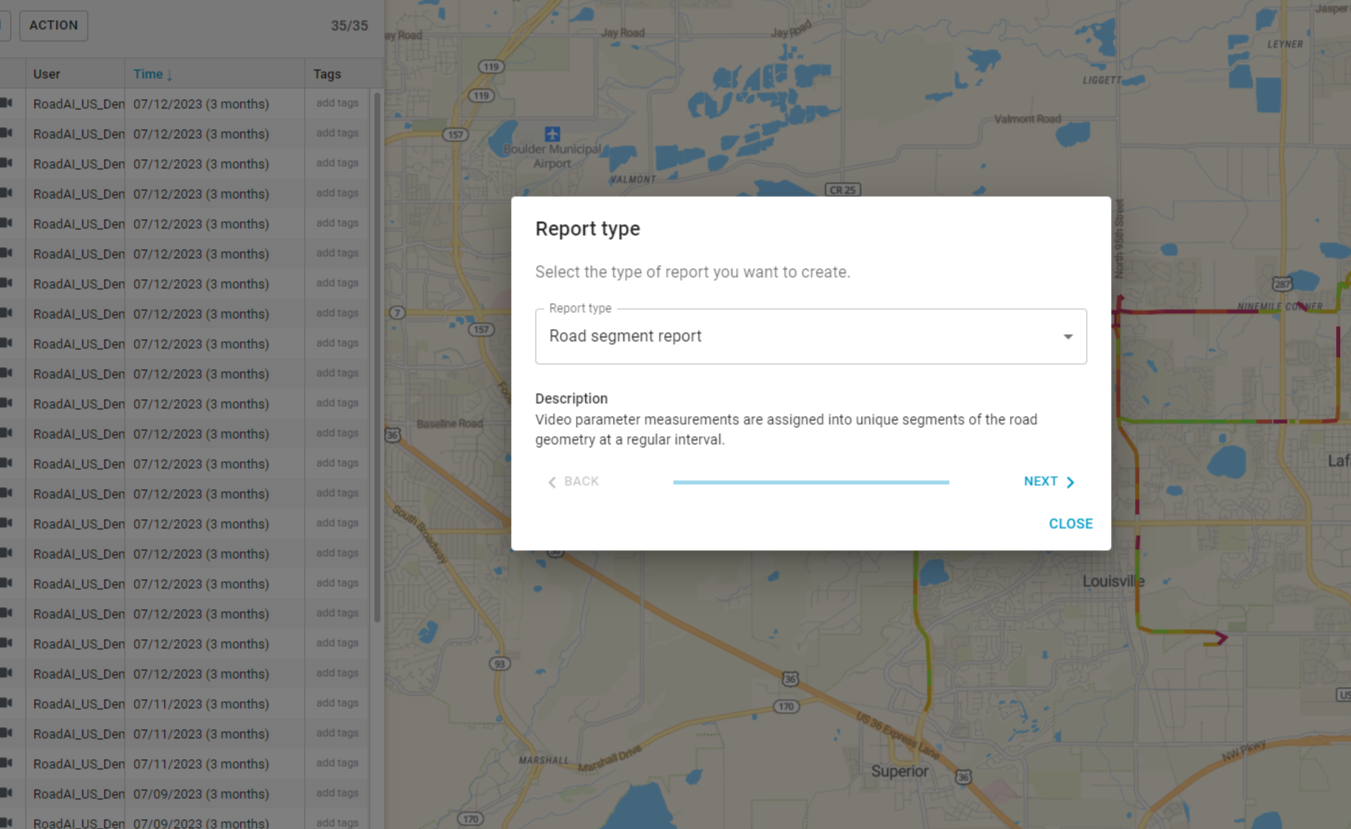
Now that you have filtered the recorded data you want to in the report, you can now create and export a report.
If you would like to review more after the video, reference our Creating Reports From Videos support page.
Test your knowledge!
In your Map Interface, can you...
1. Use the polygon tool around a small area of your network? Can you create multiple polygons?
2. Export a Road Section Report?
3. Create A Pivot Table?
4. Find the PCI of your entire network in the Pivot Table?
Module 3: Asset inventory
Not only does RoadAI collect road defects, but it also records traffic signs. Each traffic sign shows up as a point object in the Map User Interface, along with a zoomed in screenshot, sign catagory, country code, and other location of the sign. With options to create tags or action items, you can condition rate your signs and create work order reports.
Watch the video to learn how to view your traffic signs, condition rate, and create reports. Please follow along while logged into your account.
Test your knowledge!
In your Map Interface, can you...
1. Filter to have the map only show Mandatory signs?
2. Mark two signs with the "Good" action item?
3. Export an excel report of only Stop signs?
Module 4: Annotations
The annotations tool allows you to create custom tags to mark certain parts of your data. You can create a tag to video data and traffic signs.
Watch the video to learn how to create tags with your companion steering wheel Bluetooth button, on the Map Interface, and how to create annotation reports. Please follow along while logged into your account.
If you would like to review more after the video, reference our Creating Annotations support page.
Test your knowledge!
In your Map Interface, can you...
1. Filter to have the map only show Mandatory signs?
2. Mark two signs with the "Good" action item?
3. Export an excel report of only Stop signs?
Onboarding complete!
Congratulations! You have completed Onboarding for RoadAI. You will still meet with your Success Manager every 6 weeks to ensure you have the support you need to achieve your goals with RoadAI.
You have unlimited access to this guide. I recommend bookmarking and referencing back to this guide as you continue to use the app. When we have updates, I will notify your team and also add new feature training videos here.
Happy road surveying!